by Rossman Art | Nov 5, 2018 |
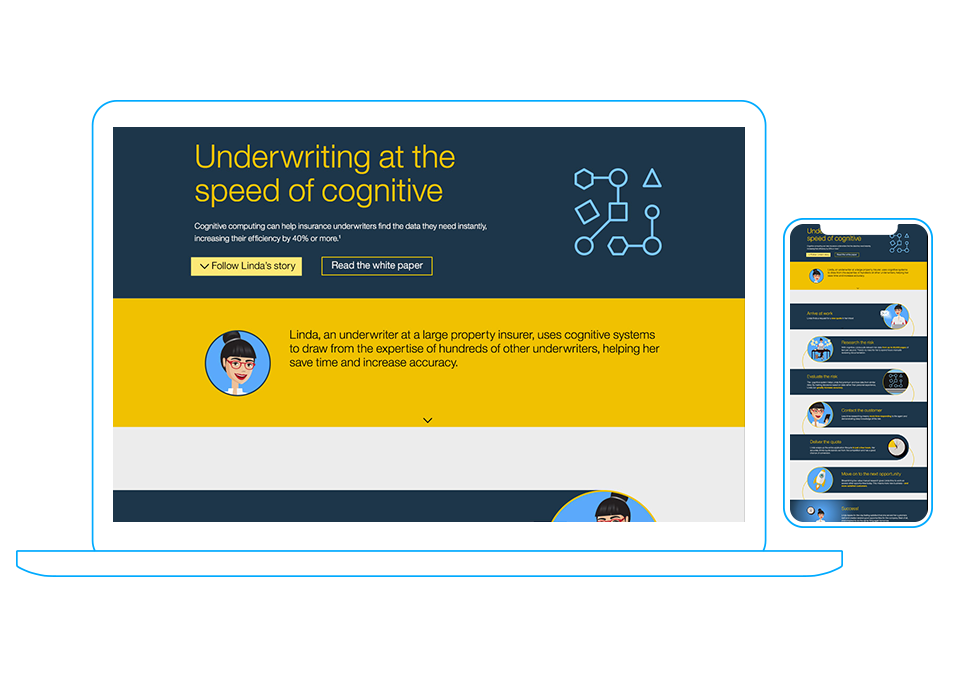
Cognitive Underwriters Infographic
This infographic was designed for IBM’s marketing department to explain a use case scenario for their AI products in the insurance industry. The infographic behaves as an interactive web page that drives the viewer through a story in the day of an insurance underwriter. Interactive elements include scroll driven sliders and transparent animated GIFs . The GIFs are scaled to 50% to smooth edge blending. All individual files weigh in at less than 350 kb for load time.
Jeff: I worked with the stakeholder and a developer to design and build this hand coded page with animated bands that lead the viewer down a story driven interactive page layout with the option to continue learning about the use case through an accompanying white paper at the end.
Animated social tile
This social tile uses one of the custom animations from the infographic embedded in a 600×320 pixel tile designed specifically for LinkedIn. The other GIFs in the infographic were created with transparent backgrounds.

by Rossman Art | Oct 29, 2018 |
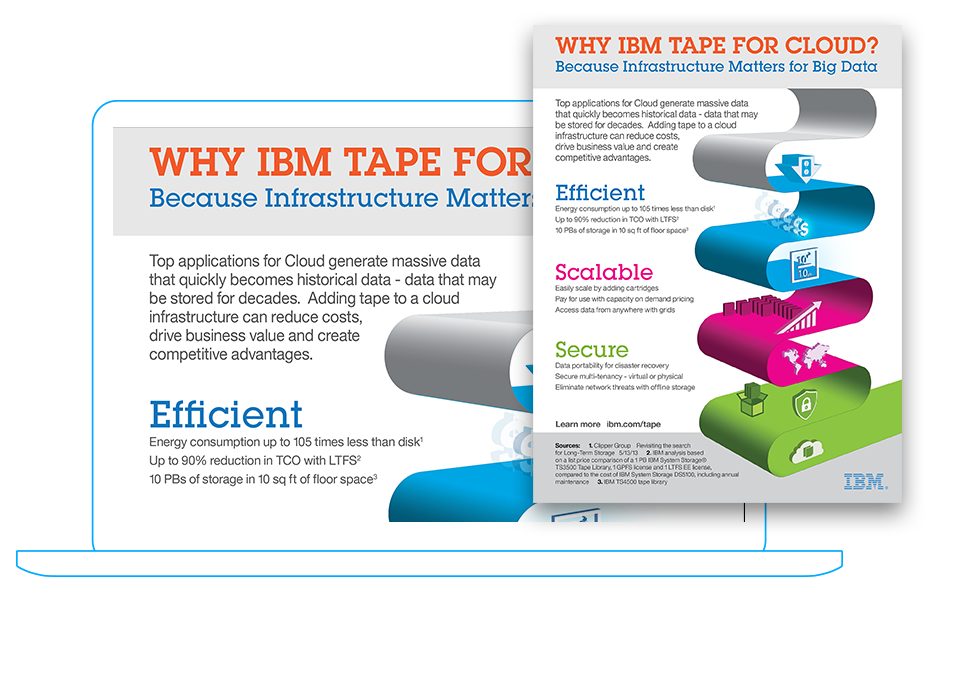
IBM Tape For Cloud Infographic
IBM storage commissioned the MSC to design an infographic that explained three major advantages that tape for cloud storage has over disk storage in the cloud. The folded tape is color coded to match the wording on the left. The graphic elements on the tape illustrate each of the main talking points in the infographic.
Jeff: I worked directly with the stakeholder as a member of IBM’s Creative Design Services team to produce this infographic for web and print media in vector format. Designed in Illustrator, this infographic can be exported to PDF for easy scaling and file sharing, and can be converted back into native file format for revisions or updates.
by Rossman Art | Sep 10, 2014 |
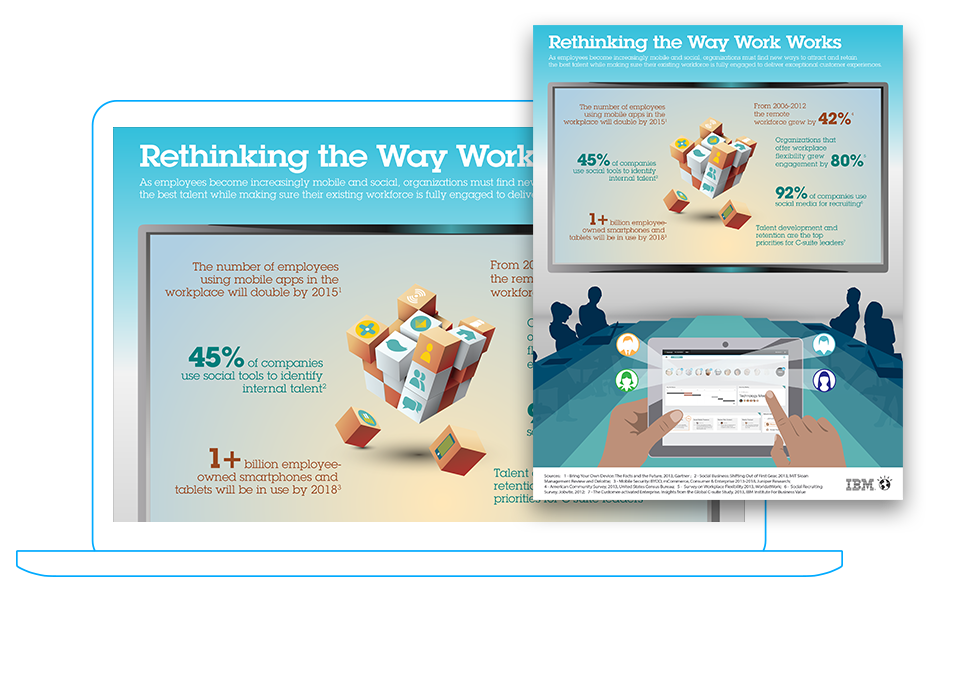
Rossman Art designed this infographic for IBM to help introduce clients to a streamlined work solution embracing work flexibility and social engagement. Its purpose was to accompany articles that discuss how IBM is innovating through new cloud based social engagement tools.
by Rossman Art | Aug 16, 2014 |
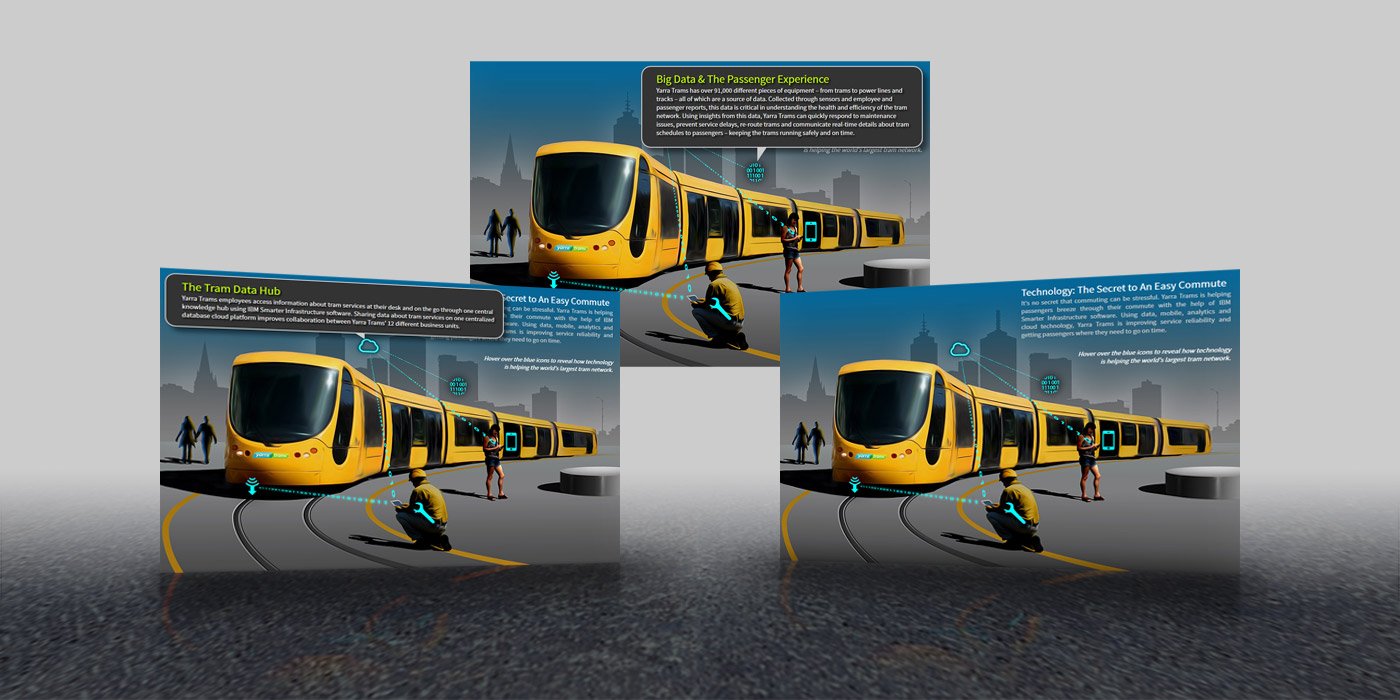
Yarra Trams Interactive Infographic Overview
Rossman Art designed and illustrated this interactive Smarter Infrastructure infographic for IBM’s external communications department. IBM used the infographic to help describe real-world use of IBM’s predictive analytics software with Yarra Trams transportation infrastructure. The infographic was assembled in HTML with embedded CSS so the final product could be delivered in as few files as possible. All the graphics reside in a background image while CSS3 handles the rollover effects.
by Rossman Art | Aug 16, 2014 |
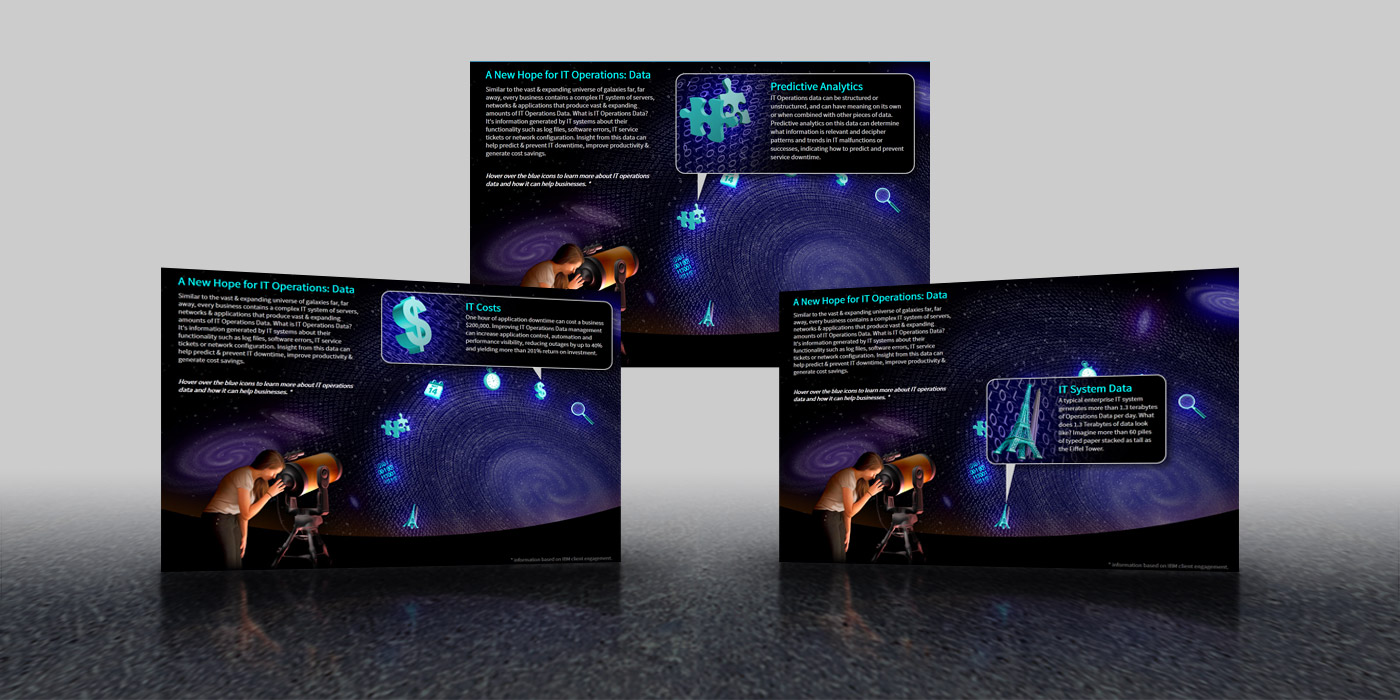
IT Operations Data Infographic
Rossman Art designed and illustrated this interactive IT Operations Data infographic for IBM’s internal communications department. IBM used this infographic to help market their software’s predictive analytics capabilities through Real-World illustrated examples and success stories. The infographic was assembled in HTML with embedded CSS so the final product could be delivered in as few files as possible. Only the background and supporting images remain as separate files.