by Rossman Art | Dec 2, 2018 |
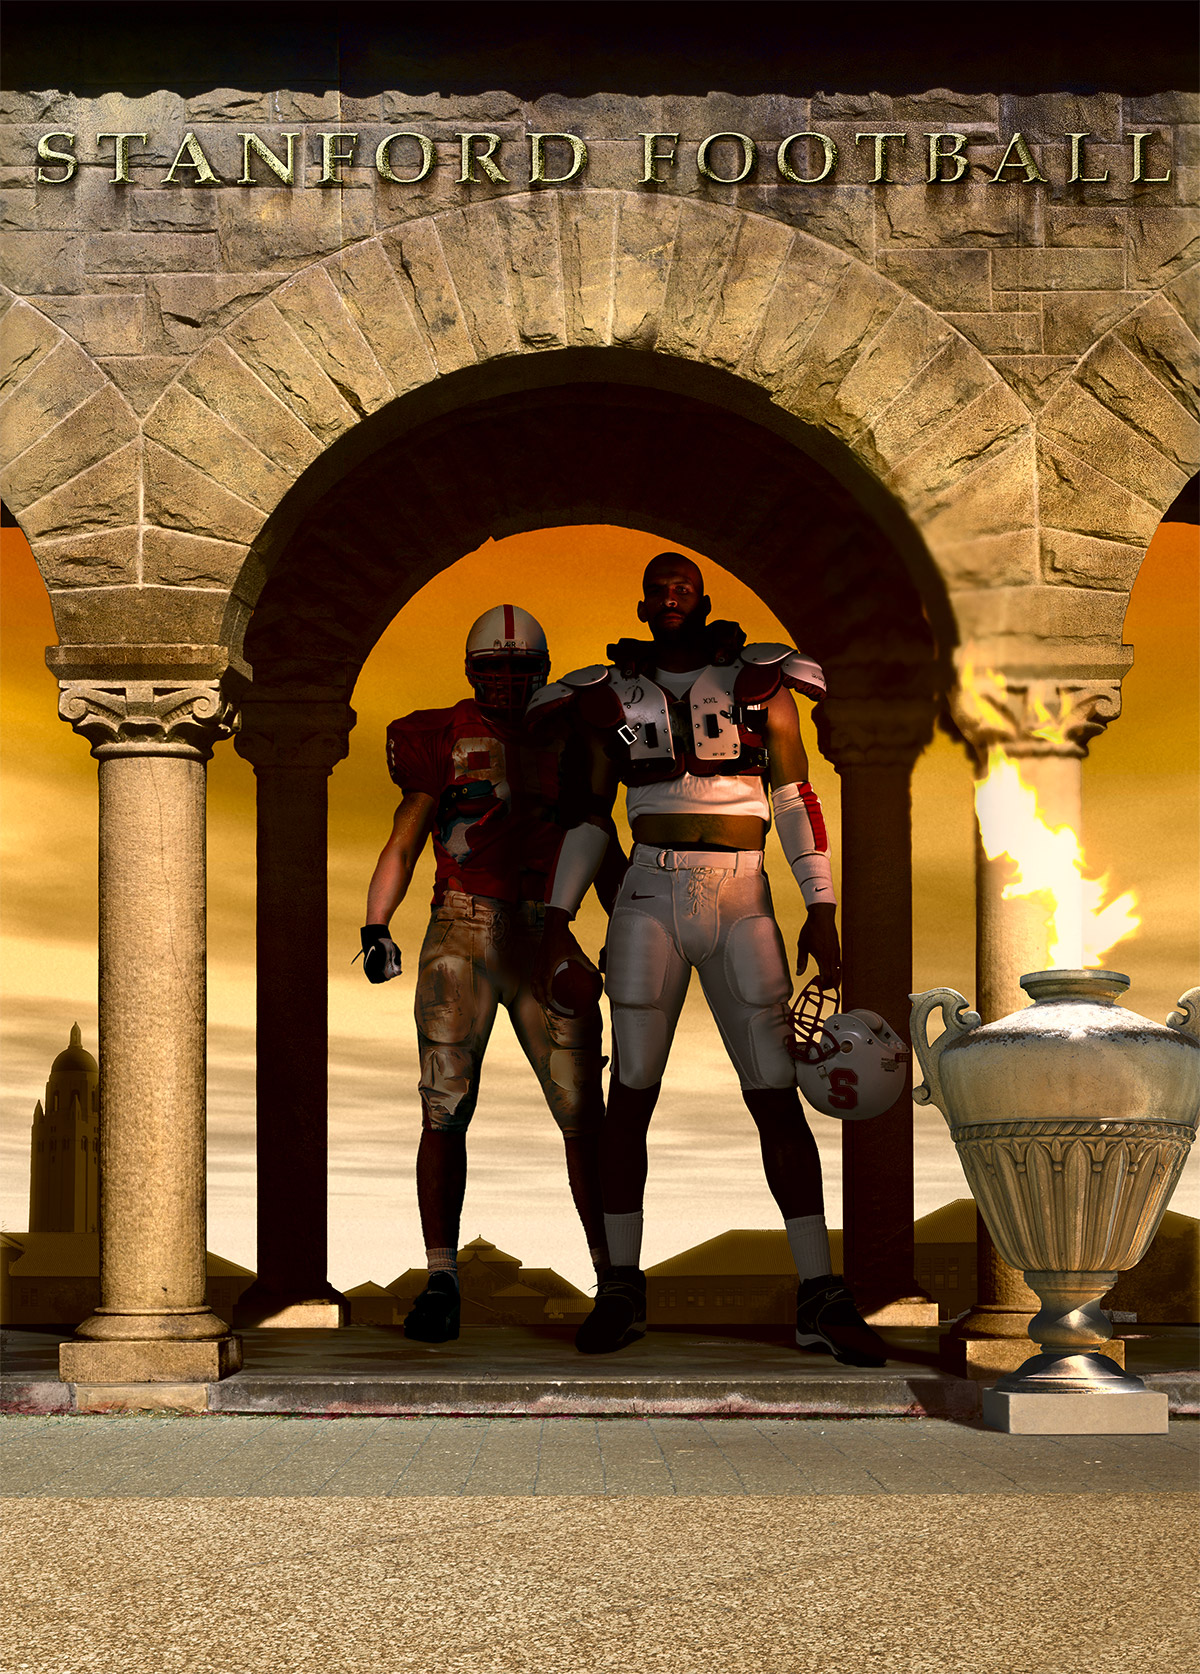
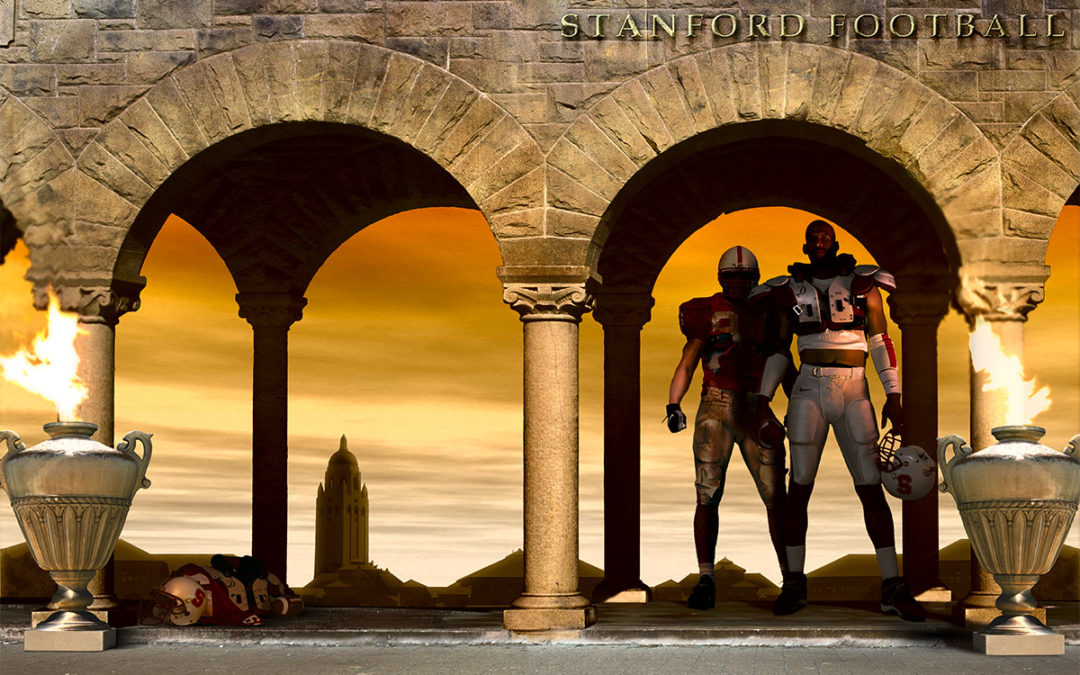
2001 Stanford Football Media Guide Cover
Rossman Art produced this media guide cover and poster in collaboration with Terry Smith Creations for Stanford University’s 2001 football season. A major purpose for this and other media guides is as a recruiting tool to new players. Media guide covers are often the first introduction for these potential All-Stars. Therefore, an identifiable and eye-catching image is paramount. This design captured that goal with a gladiator theme.
by Rossman Art | Nov 27, 2018 |
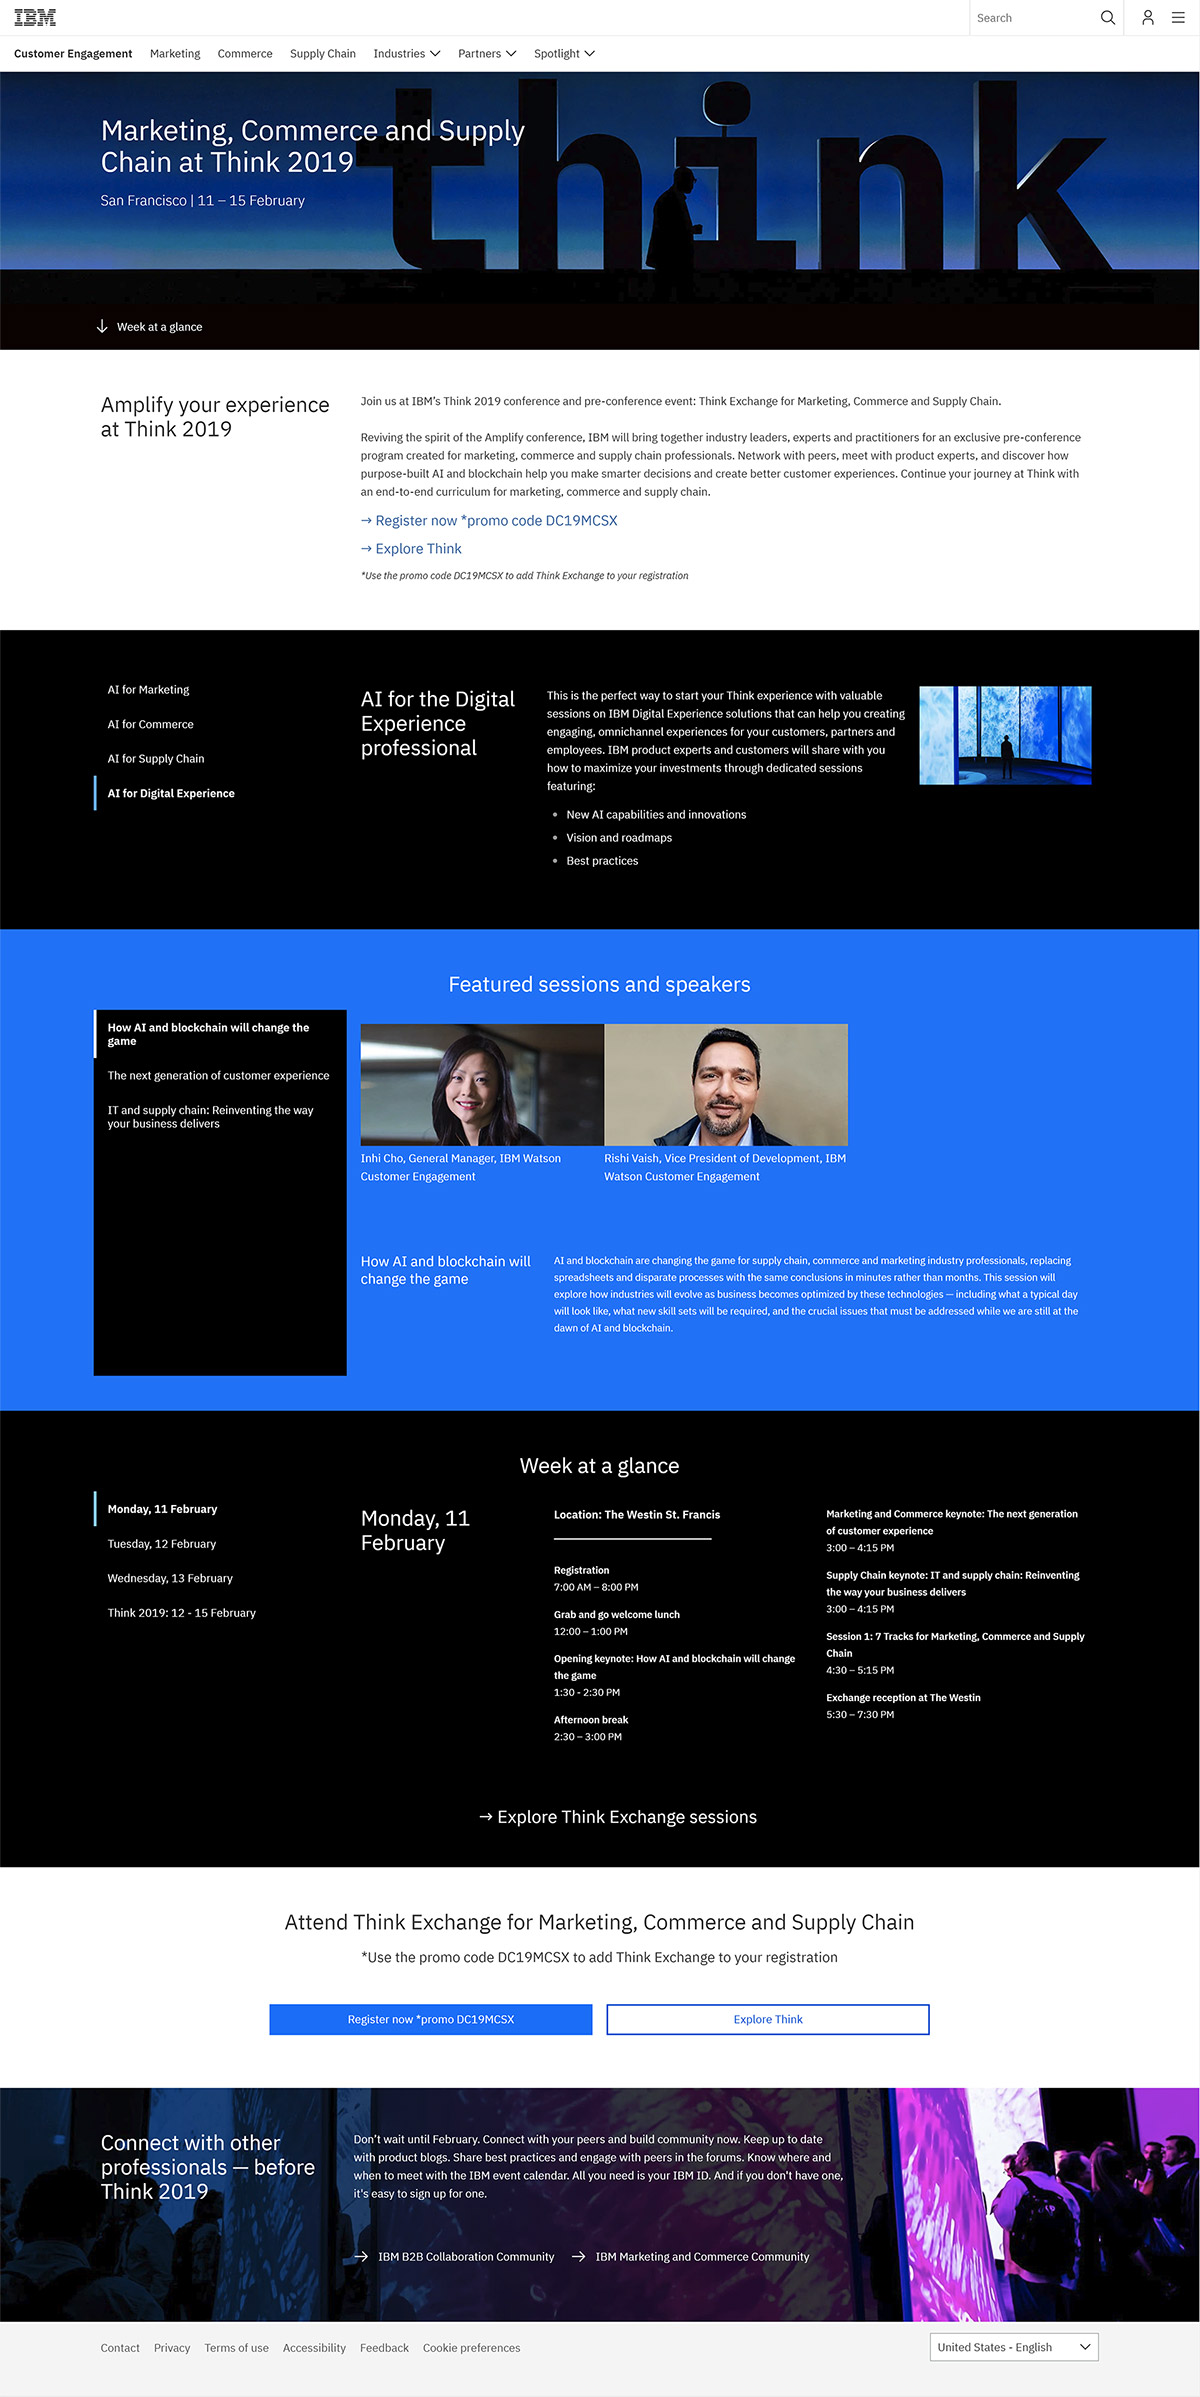
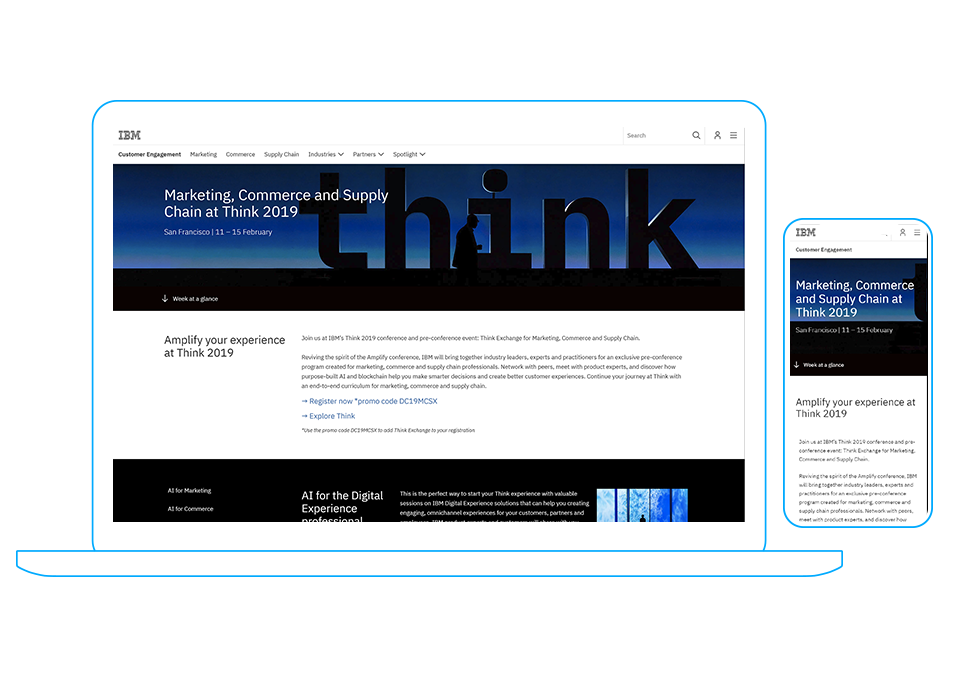
The Think 2019 page lands users on a customized overview of this event for Watson’s Marketing, Commerce, and Supply Chain segments. It provides participants with relevant scheduling information and featured speakers in these segments. This static image of the page shows a small amount of the actual content embedded in the dynamic tabs on the page.
Jeff: I custom built the Think 2019 page to spec with help from my agile team and input from our stakeholders. The team iterated on this page as the event date approached. What is seen here is a snapshot in time capturing a major launch which took place on 11/22/18.
by Rossman Art | Nov 23, 2018
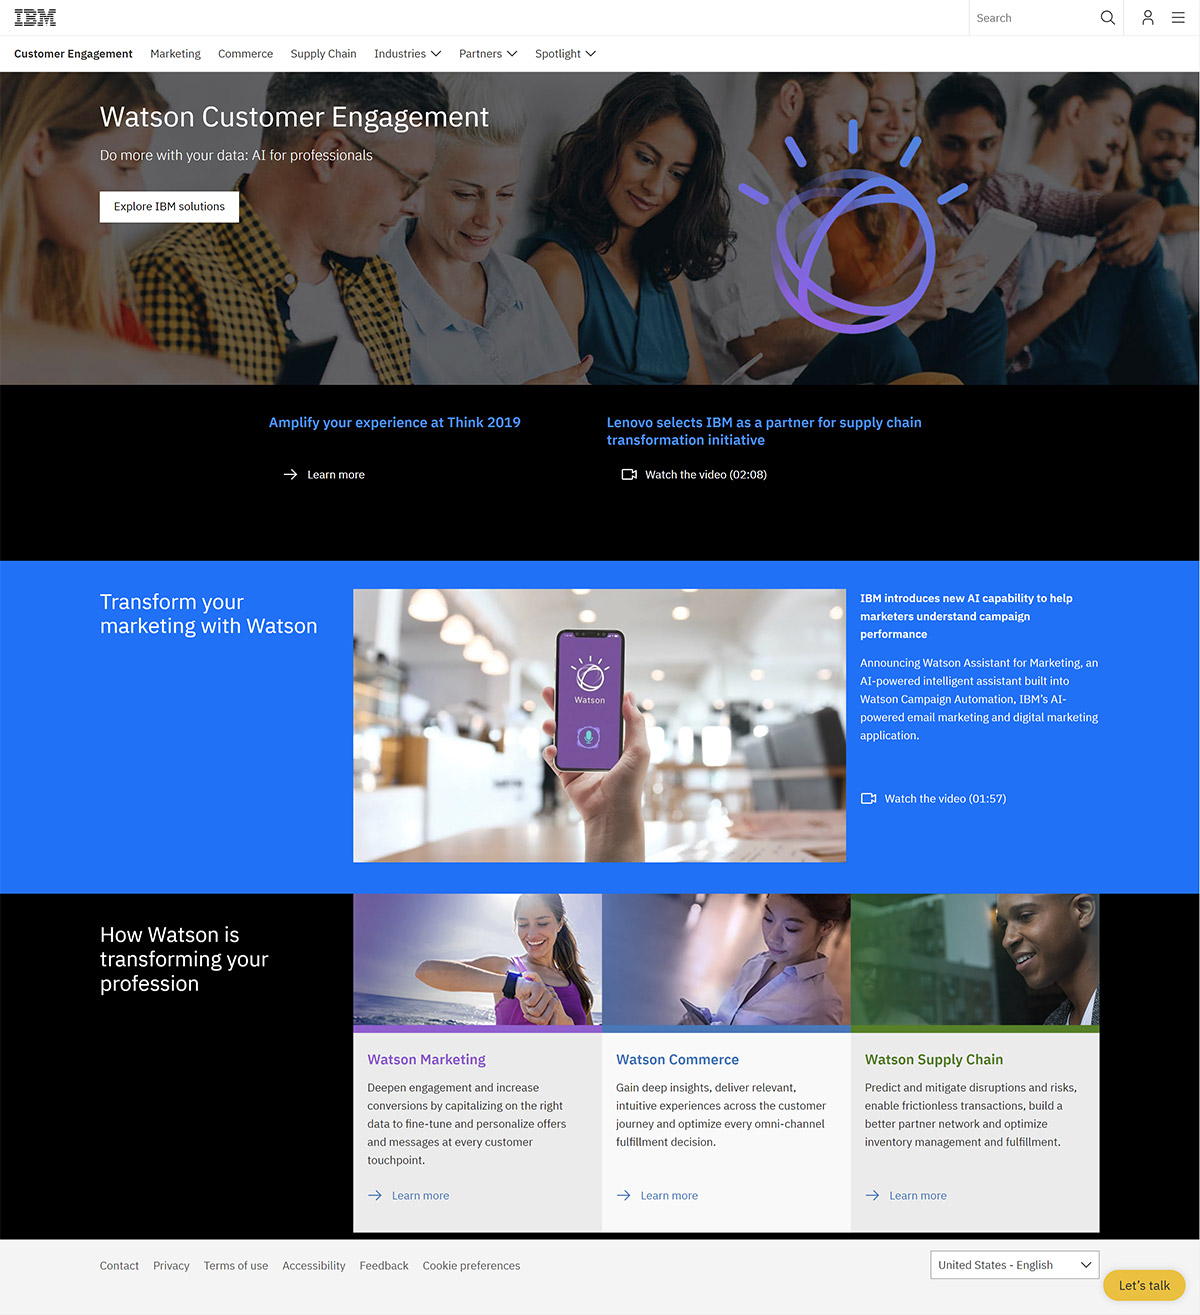
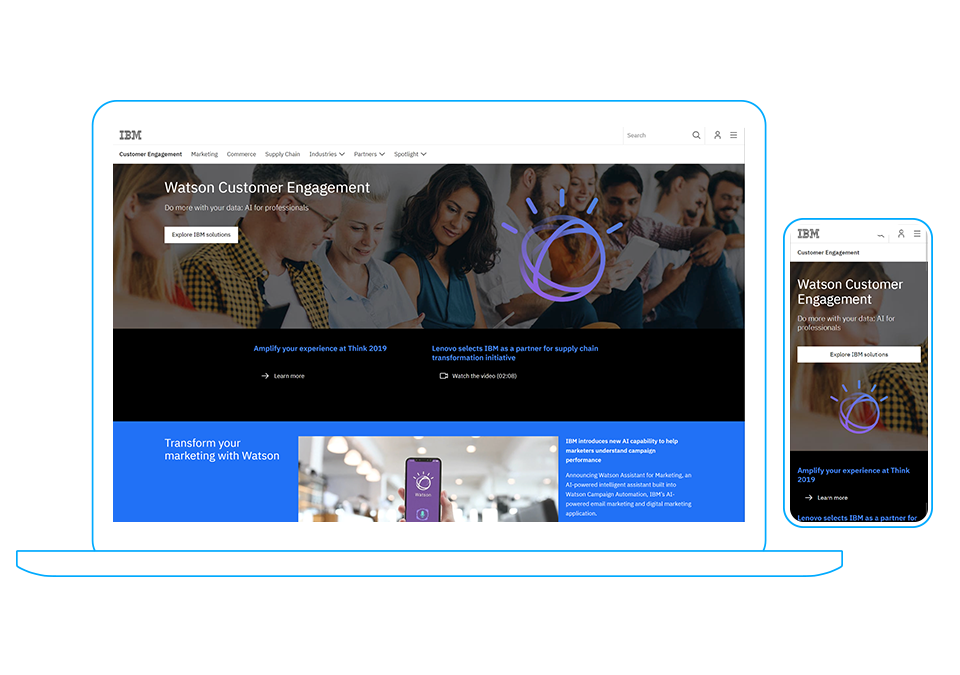
Watson Customer Engagement
The Watson Customer Engagement home page lands users on a top level overview of Watson’s Marketing, Commerce, and Supply Chain segments. It is updated with relevant promotions and events in the top bands and drives users to the three segment pages in the lower band where potential customers can move into a more detailed description for each segment and offering.
Jeff: I worked with an agile team on the IA, Content, layout, look, and performance of the page for mobile and desktop. We developed the page inside a template driven content management system under Watson branding guidelines.
This page page has been retired, but the images captured here represent a major launch which took place on 10/29/18.
by Rossman Art | Nov 16, 2018
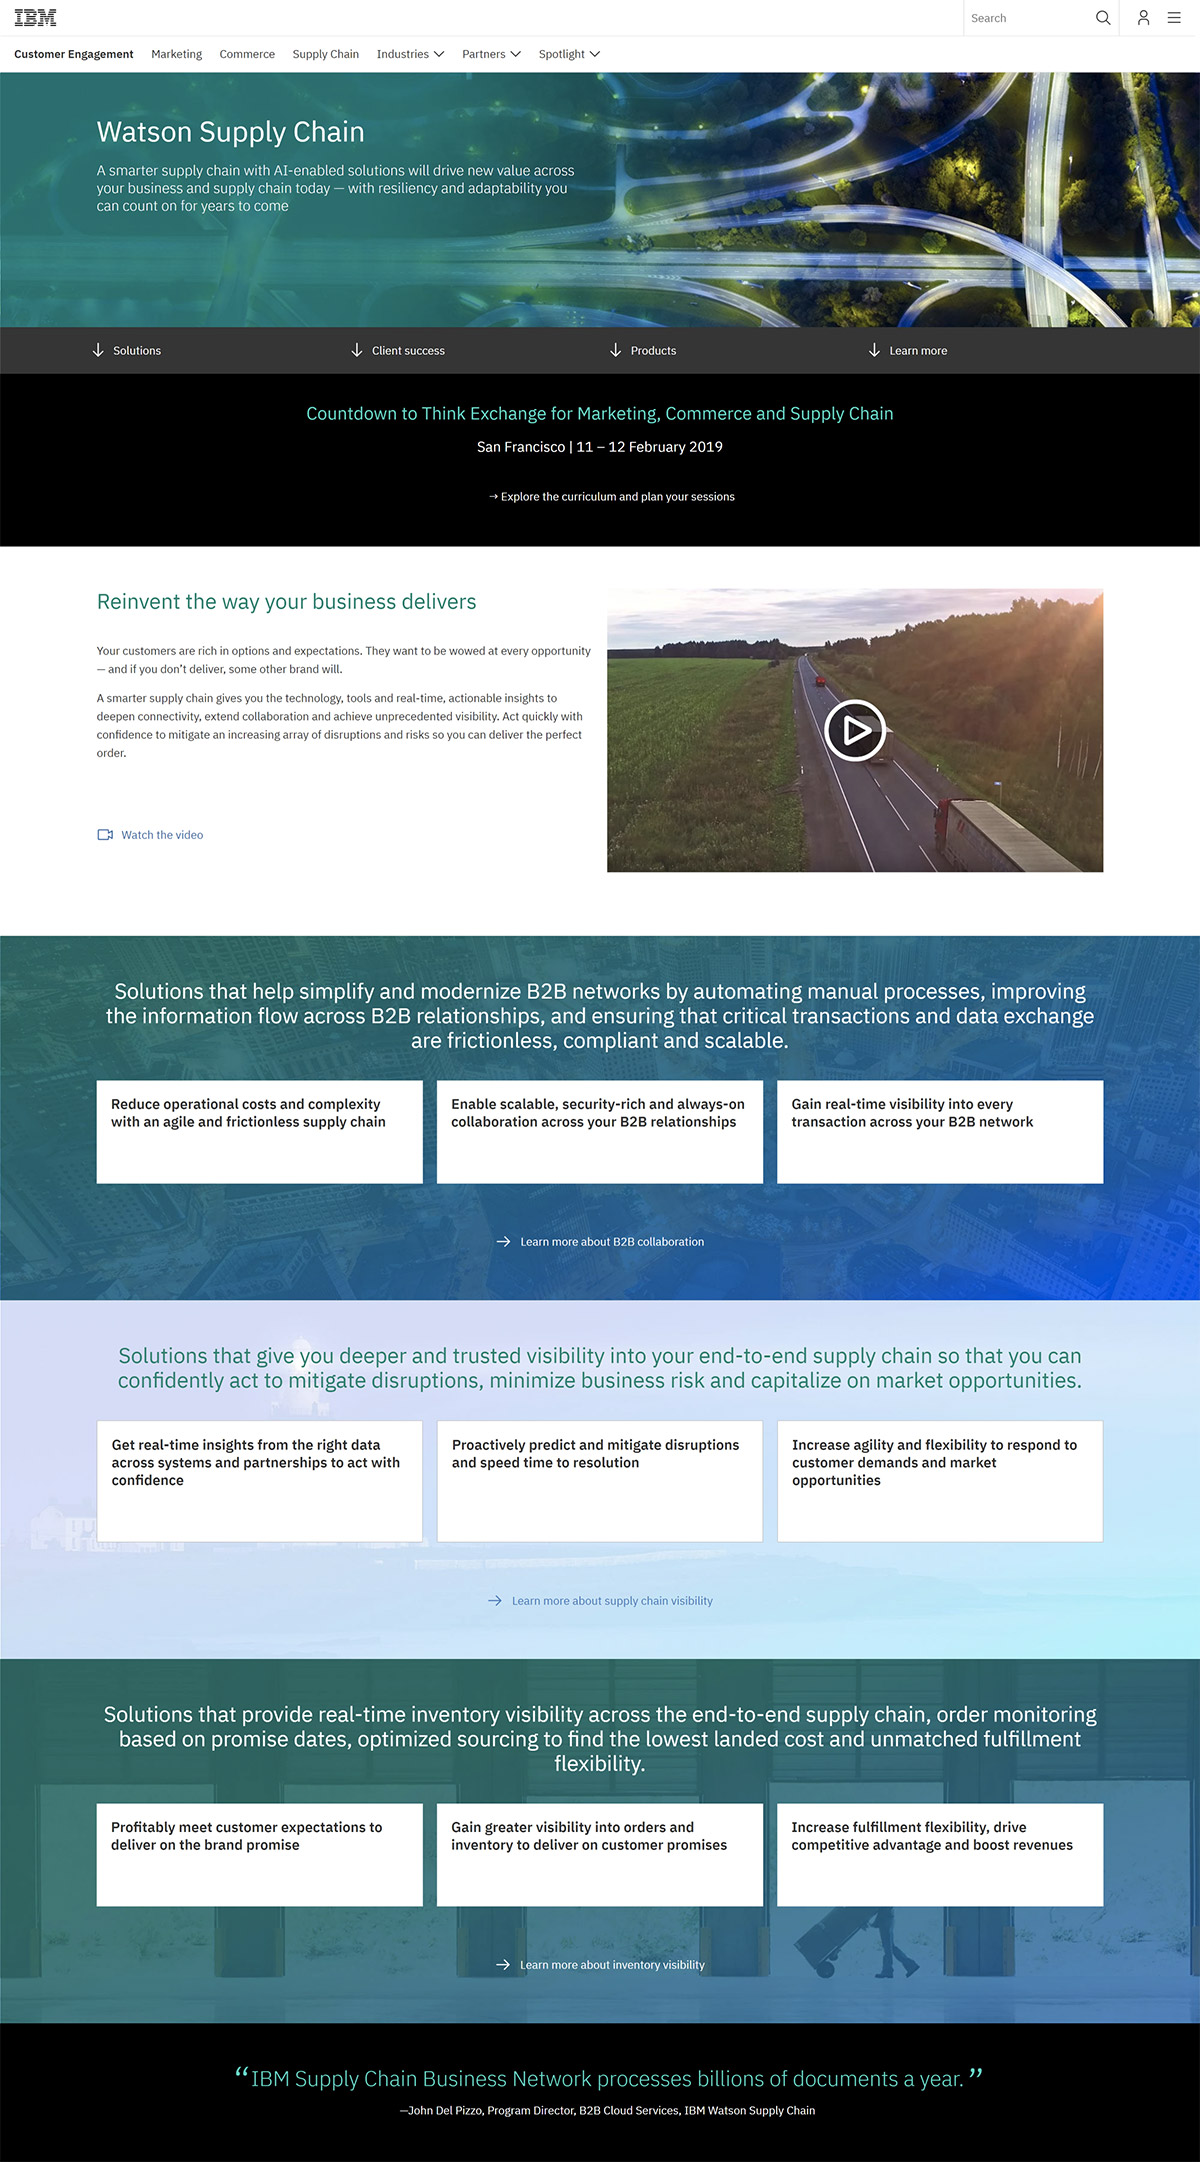
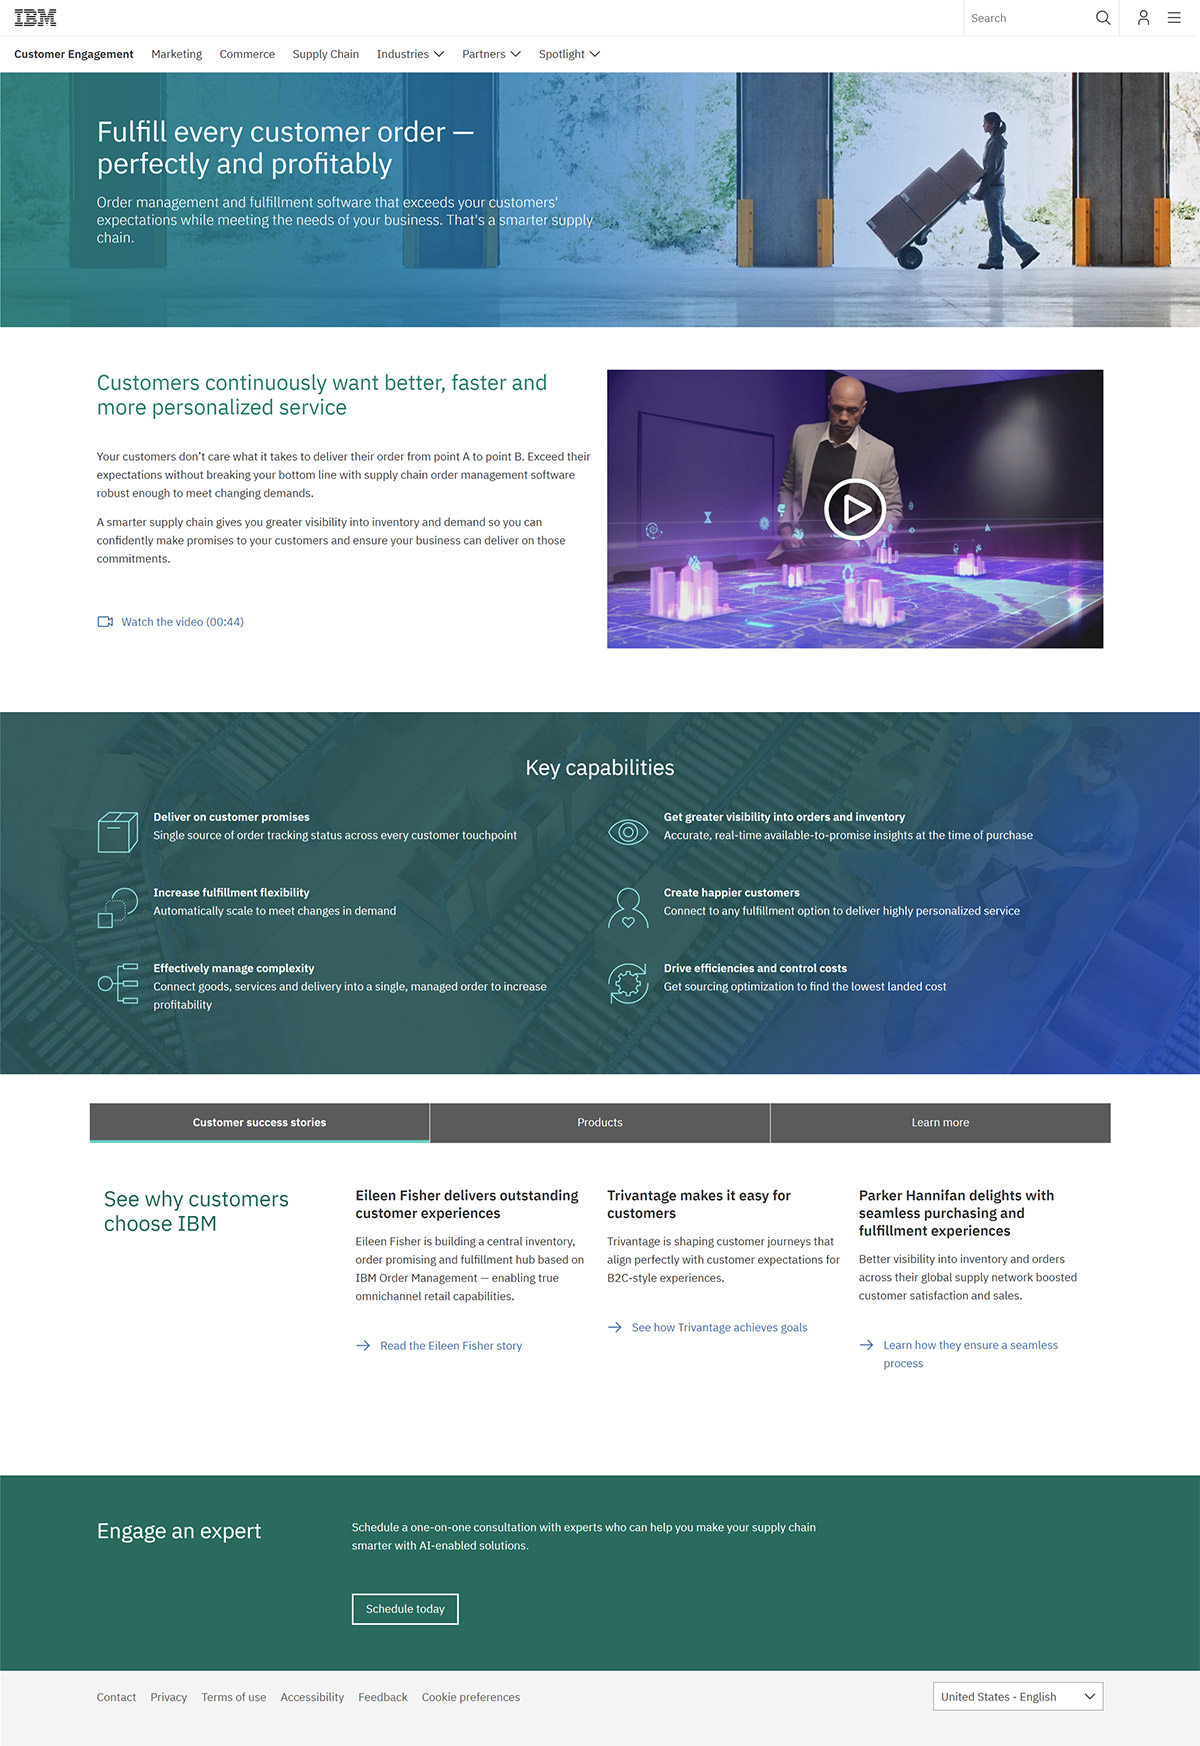
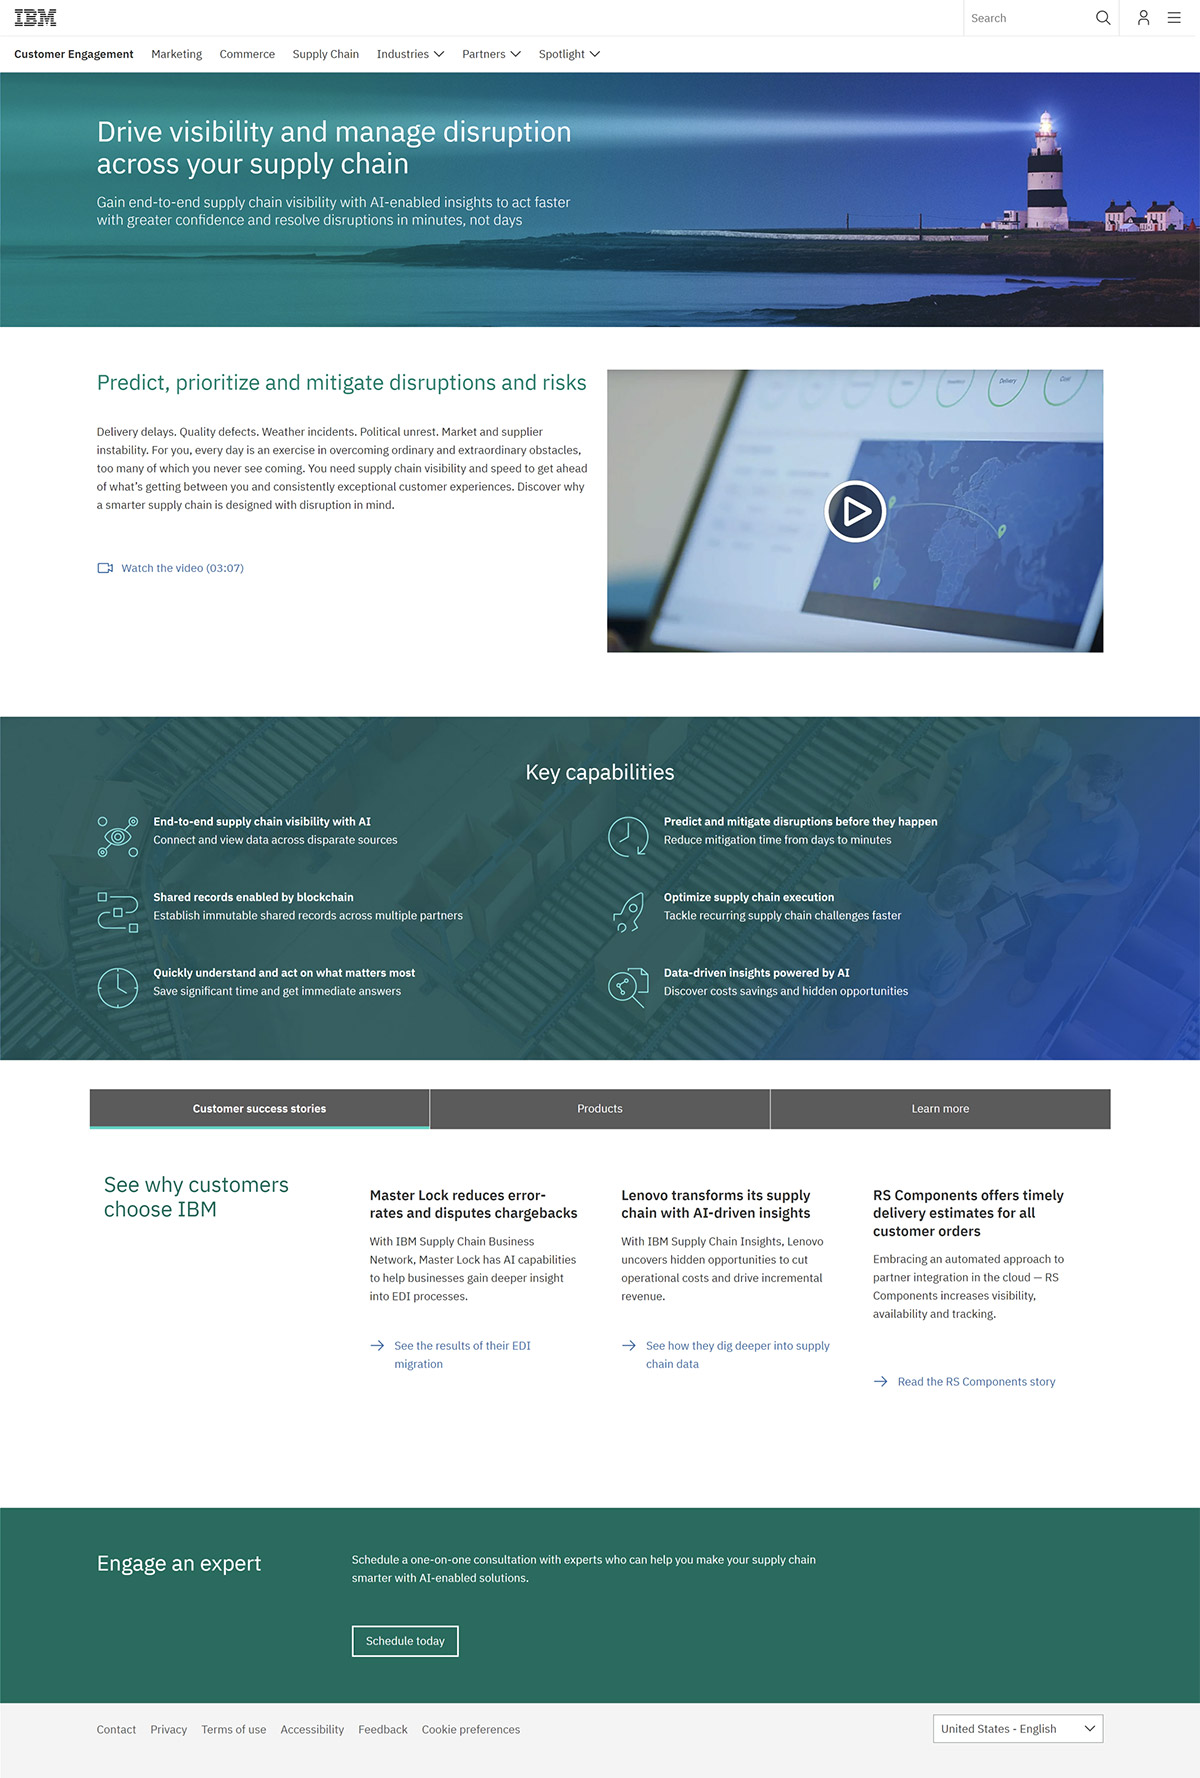
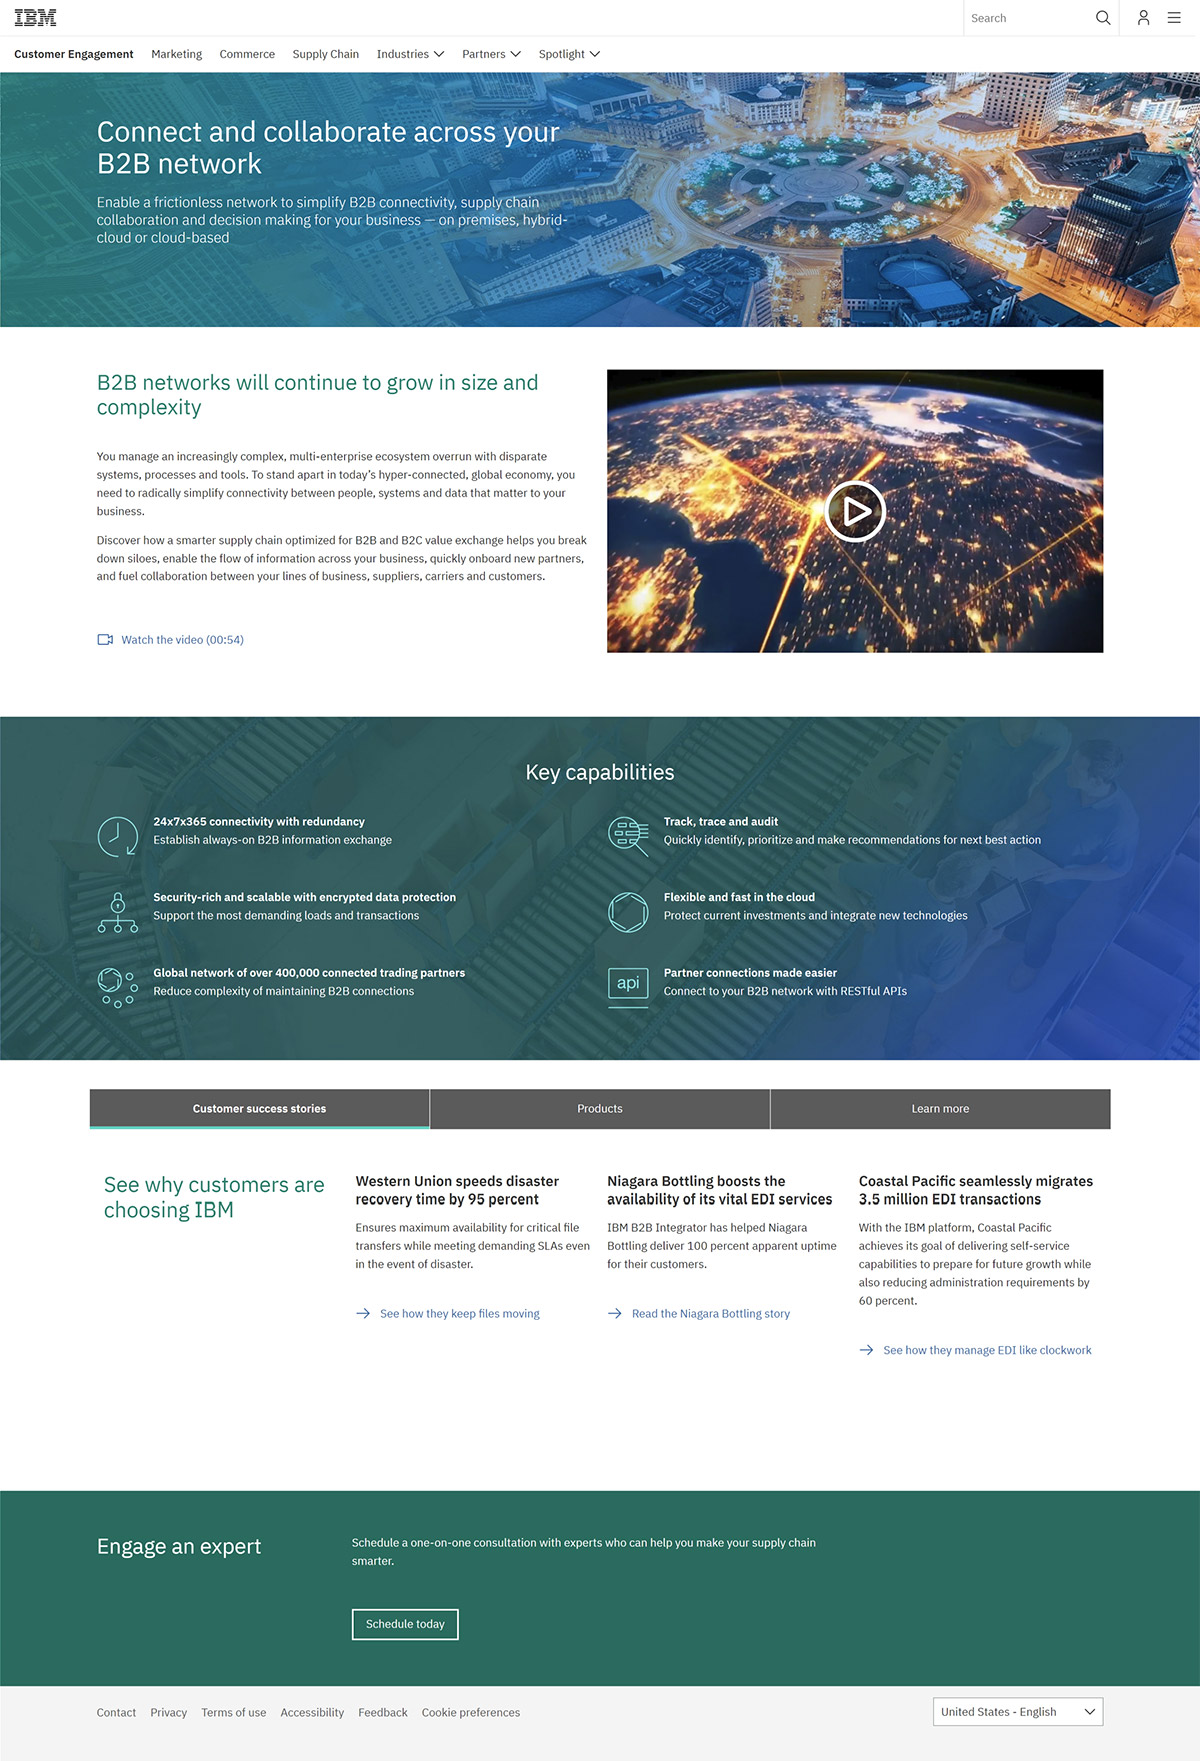
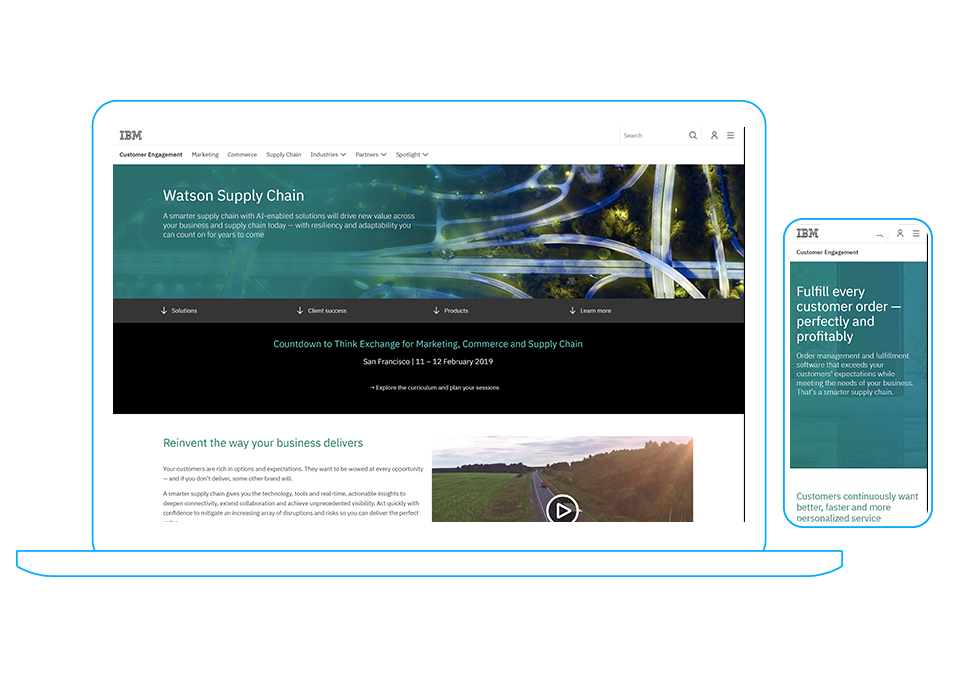
Watson Supply Chain Solutions
The supply chain site contains 4 top level pages designed to present an overview of Watson’s AI capabilities in supply chain though analyst reporting, case studies, product offerings, and supporting resources. The home page contains three “Solutions” bands that link to the Solution pages which move deeper into segment features where customers can decide which products may work best for their business needs.
Jeff: I worked with an agile team on the IA, Content, layout, look, and performance of the pages for mobile and desktop. We developed the pages inside a template driven content management system under Watson branding guidelines. Color and image were key factors in determining the design and branding of the site as it relates to two other Watson pillar sites, Commerce and Marketing. Supply Chain uses a dominant teal with blue accents to brand page content.
These pages are snapshots in time that represent a major launch which took place on 11/14/18.
by Rossman Art | Nov 8, 2018
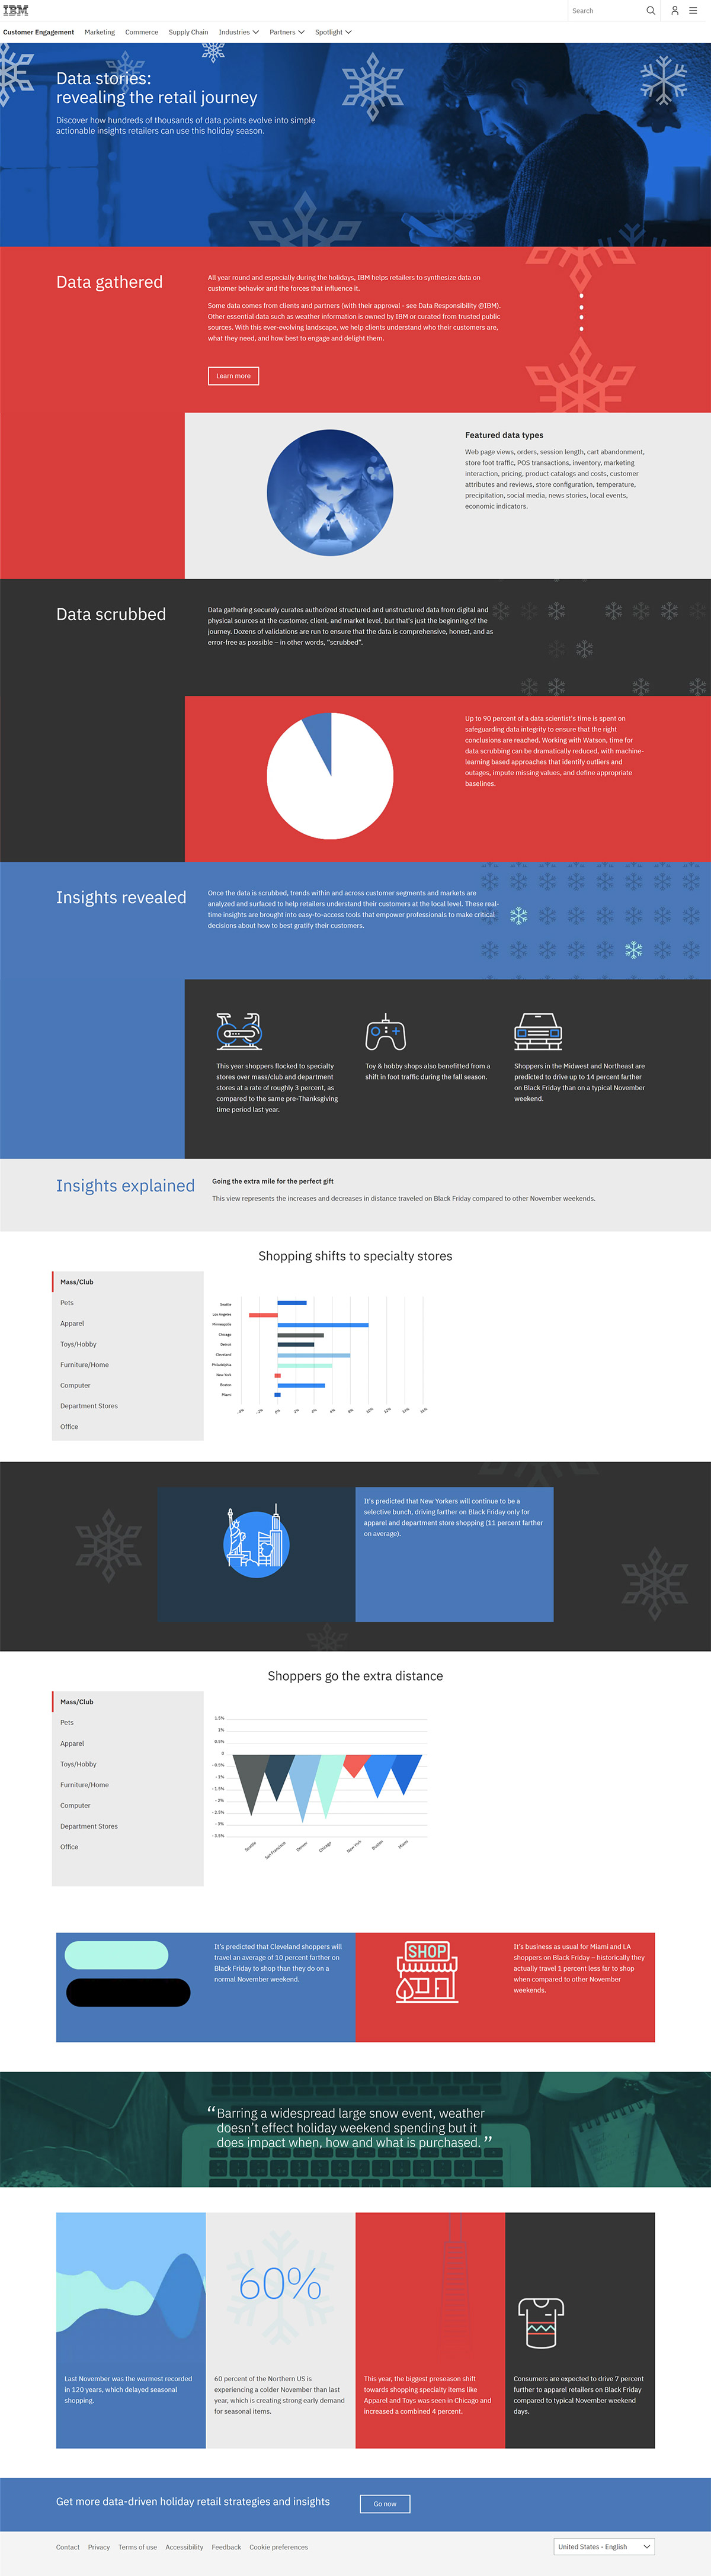
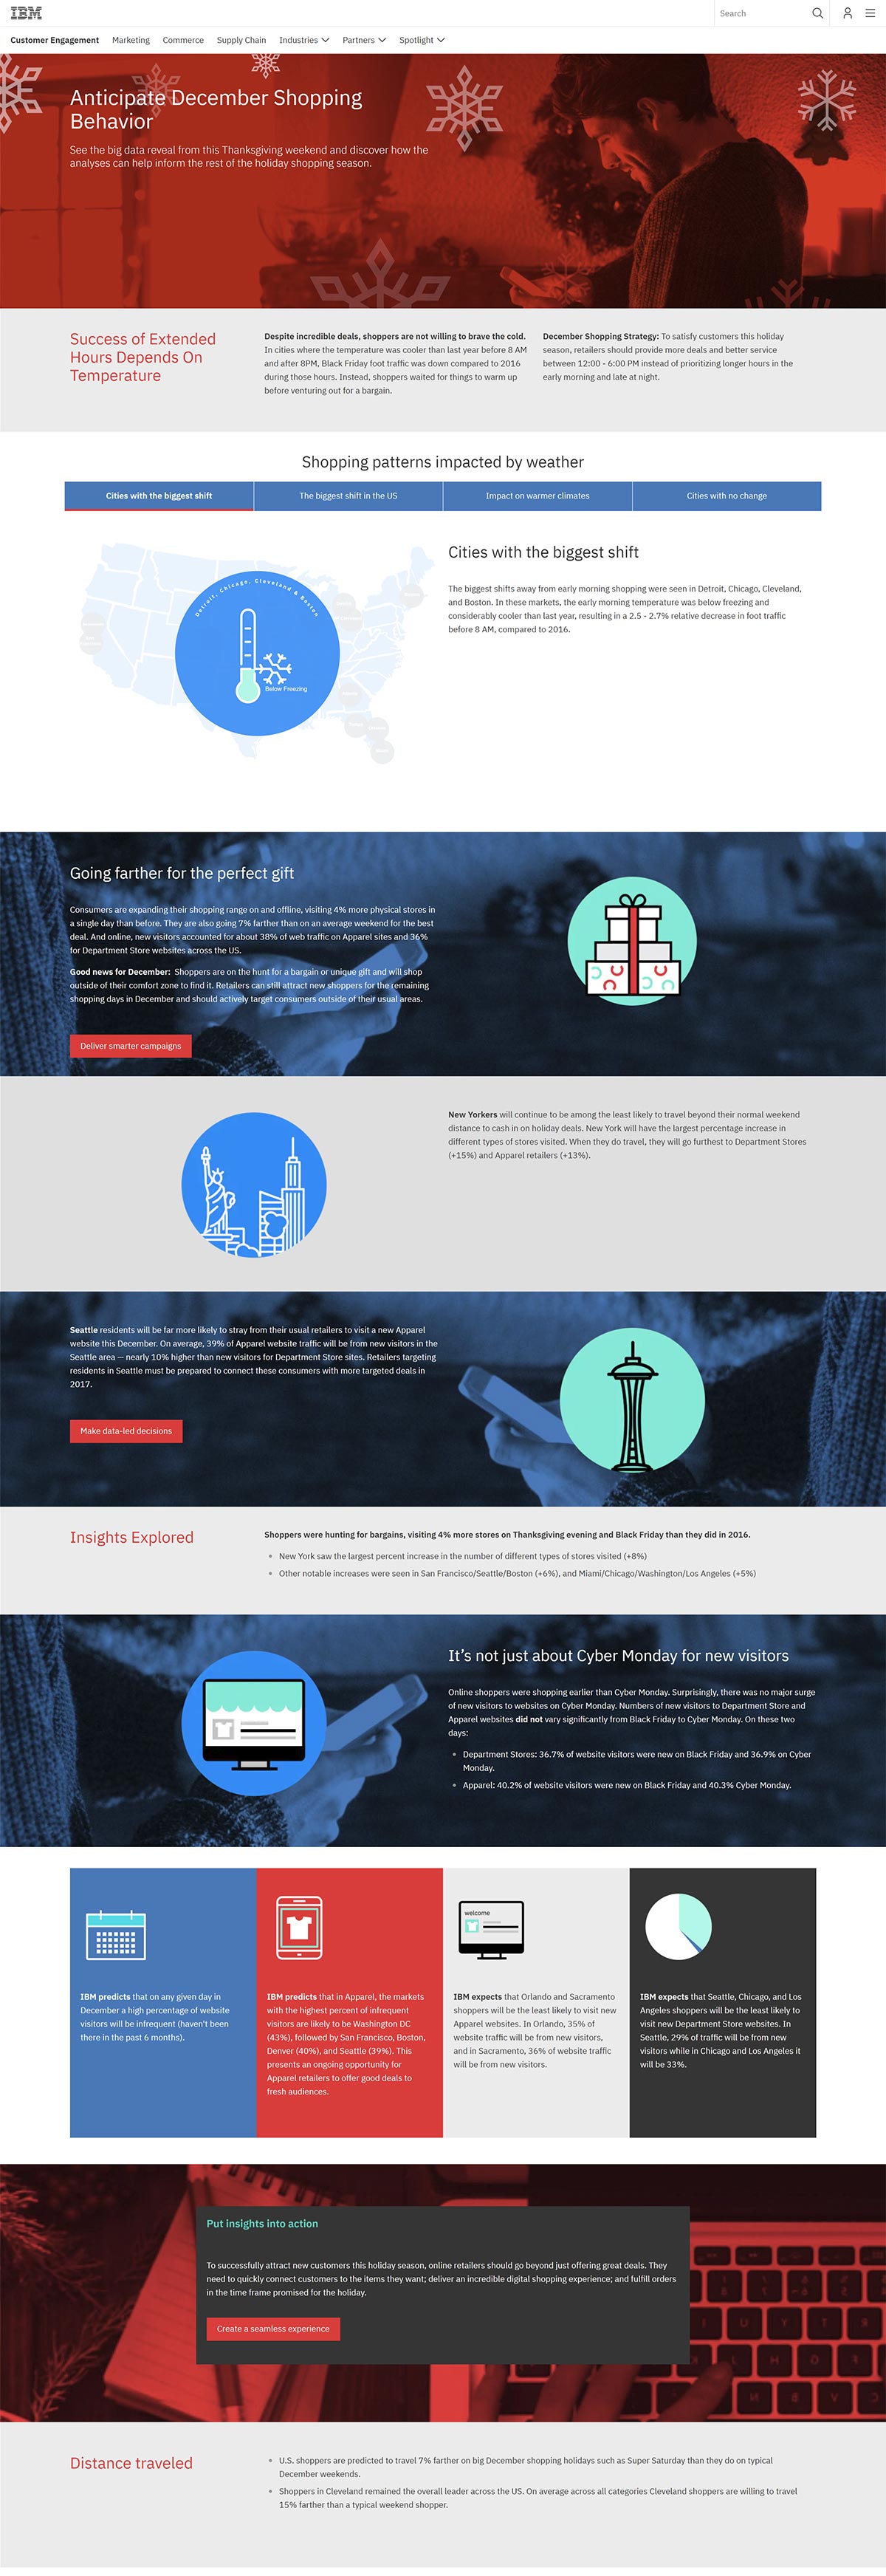
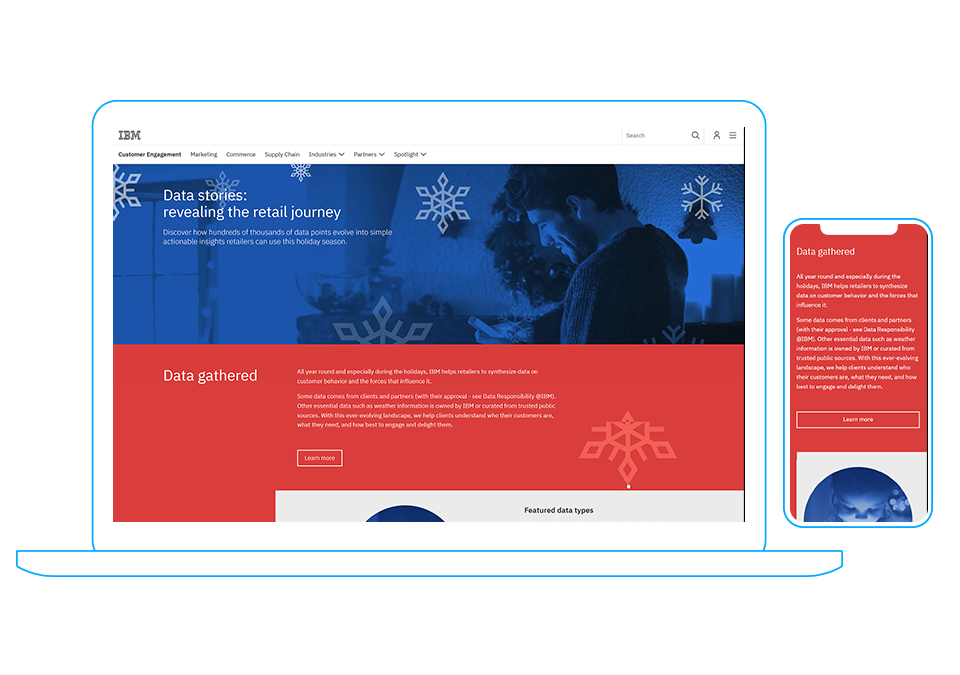
IBM 2018 Holiday Visualization Pages
In November and December of 2017 Watson Customer Engagement was tasked with creating two pages devoted to holiday season buying trends. Watson AI was employed to gain insight into variables such as weather, distance traveled to retailers, online buying habits, and other factors. The results were published in a timely manner for the 2018 new year.
Jeff: I worked directly with the stakeholder, their content designer, and team of content writers to translate two hand coded pages into IBM’s Drupal CMS. I worked with the designer on graphic asset creation and used my knowledge with the CMS to build the pages from scratch. Once the pages were built out graphically I worked with the content writers to refine the layout and advise them on character count and font scaling. Data was also still being collected as these pages were built through December of 2017, so the pages went through multiple iterations after publication. This was only possible through the rapid template creation and publication capabilities within the CMS. Results went live within minutes!
Holiday Sales Visualization Page
This page focuses on the data gathering methods and insights that can benefit retailers. Visit the live page to access all the tabbed content within the page.
Holiday Sales Prediction Page
This page focuses on the predictions and results gathered from data. Visit the live page to access all the tabbed content within the page.