IBM 2018 Holiday Visualization Pages
In November and December of 2017 Watson Customer Engagement was tasked with creating two pages devoted to holiday season buying trends. Watson AI was employed to gain insight into variables such as weather, distance traveled to retailers, online buying habits, and other factors. The results were published in a timely manner for the 2018 new year.
Jeff: I worked directly with the stakeholder, their content designer, and team of content writers to translate two hand coded pages into IBM’s Drupal CMS. I worked with the designer on graphic asset creation and used my knowledge with the CMS to build the pages from scratch. Once the pages were built out graphically I worked with the content writers to refine the layout and advise them on character count and font scaling. Data was also still being collected as these pages were built through December of 2017, so the pages went through multiple iterations after publication. This was only possible through the rapid template creation and publication capabilities within the CMS. Results went live within minutes!
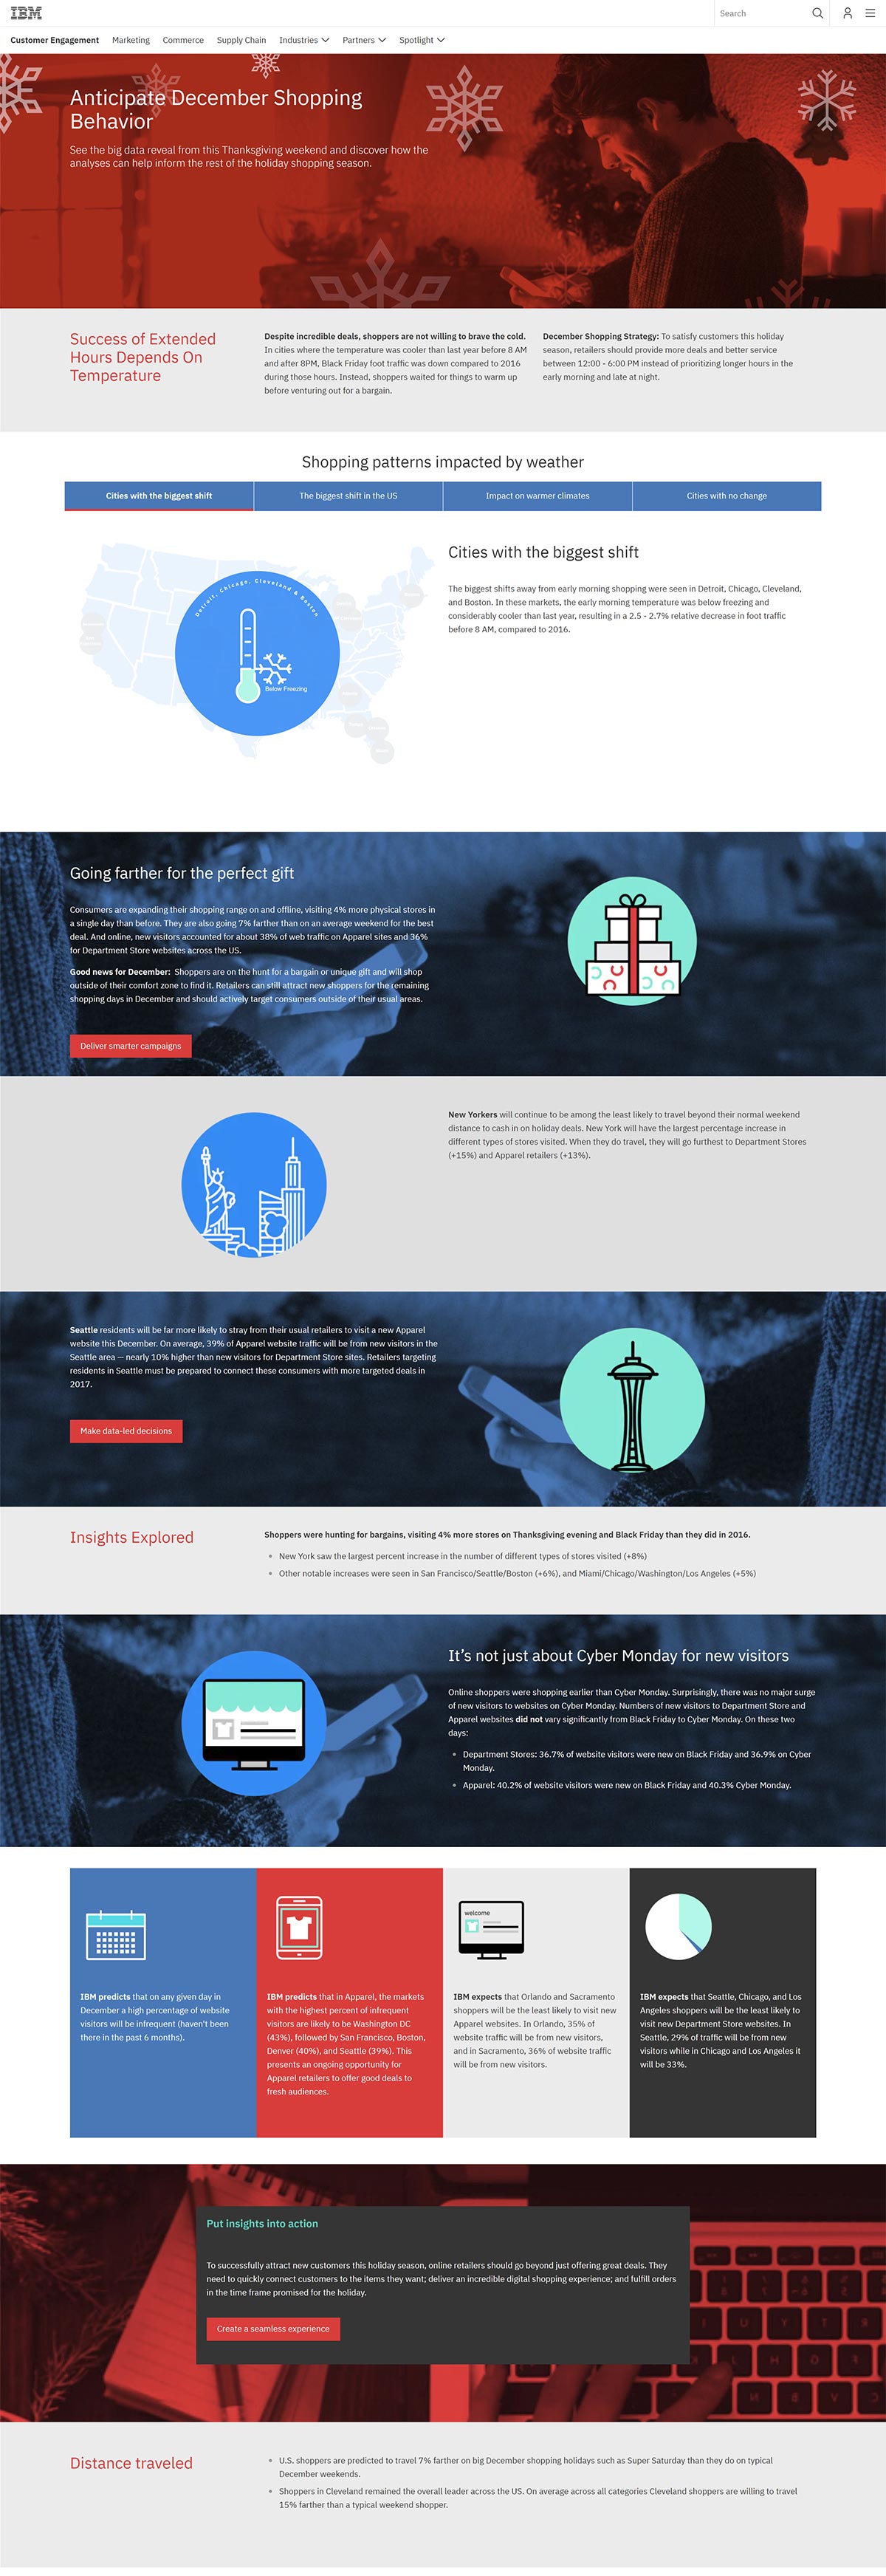
Holiday Sales Visualization Page
This page focuses on the data gathering methods and insights that can benefit retailers. Visit the live page to access all the tabbed content within the page.
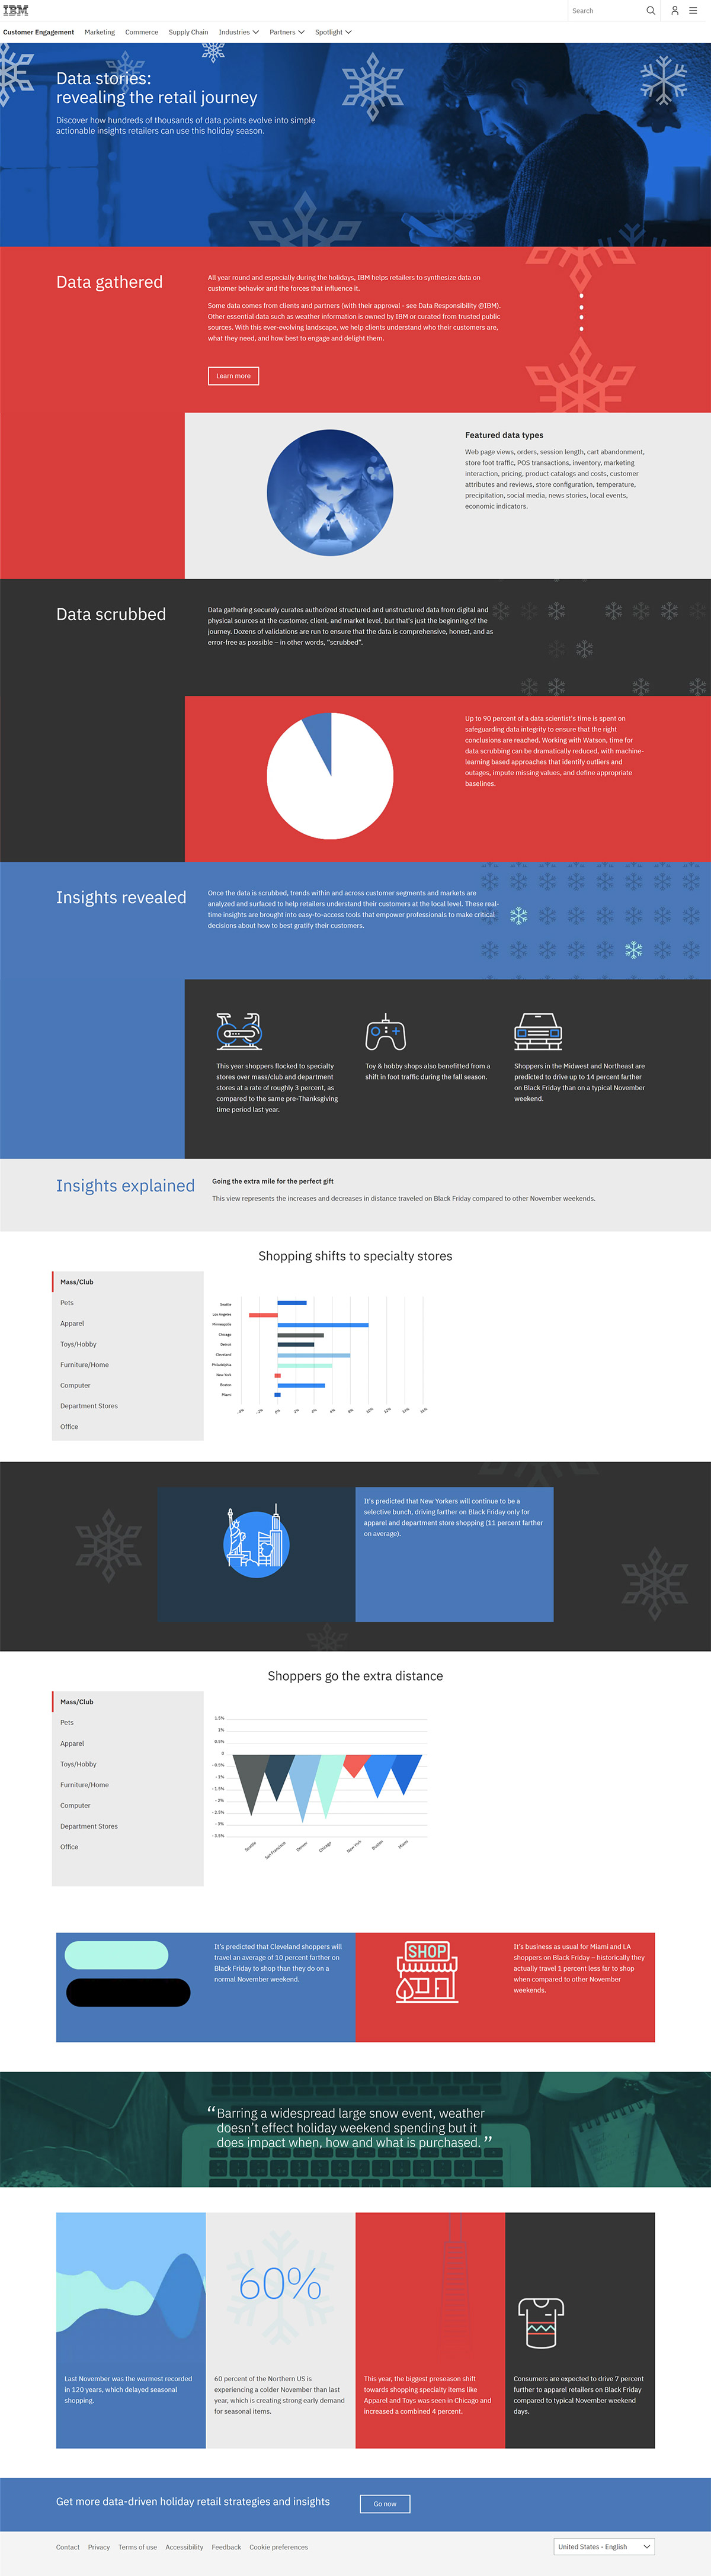
Holiday Sales Prediction Page
This page focuses on the predictions and results gathered from data. Visit the live page to access all the tabbed content within the page.