by Rossman Art | Aug 17, 2014 |
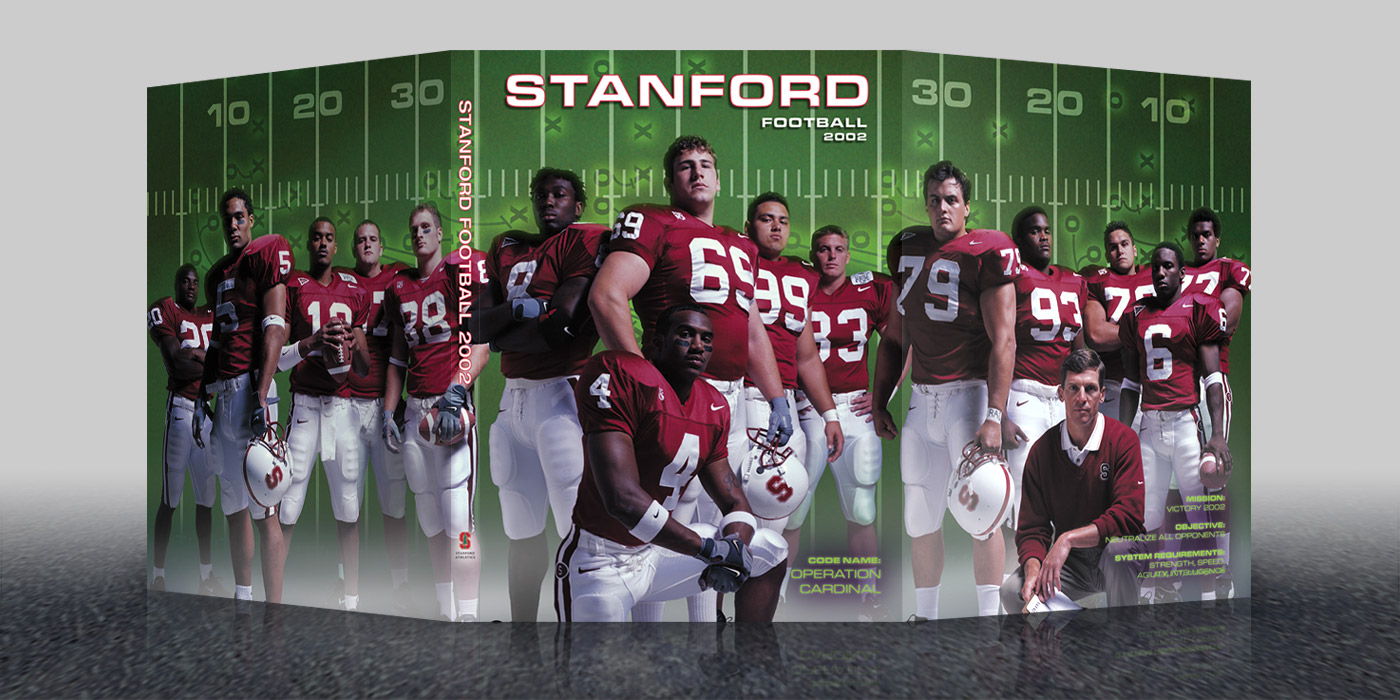
2002 Stanford Football Media Guide Cover
Rossman Art produced this tri-fold media guide cover with Photoshop and Illustrator for the Stanford University Athletics Department in collaboration with Terry Smith Creations. This work is one of a larger body of award winning media guides produced for Stanford’s football and basketball programs between the years 1997-2007.
by Rossman Art | Aug 16, 2014 |
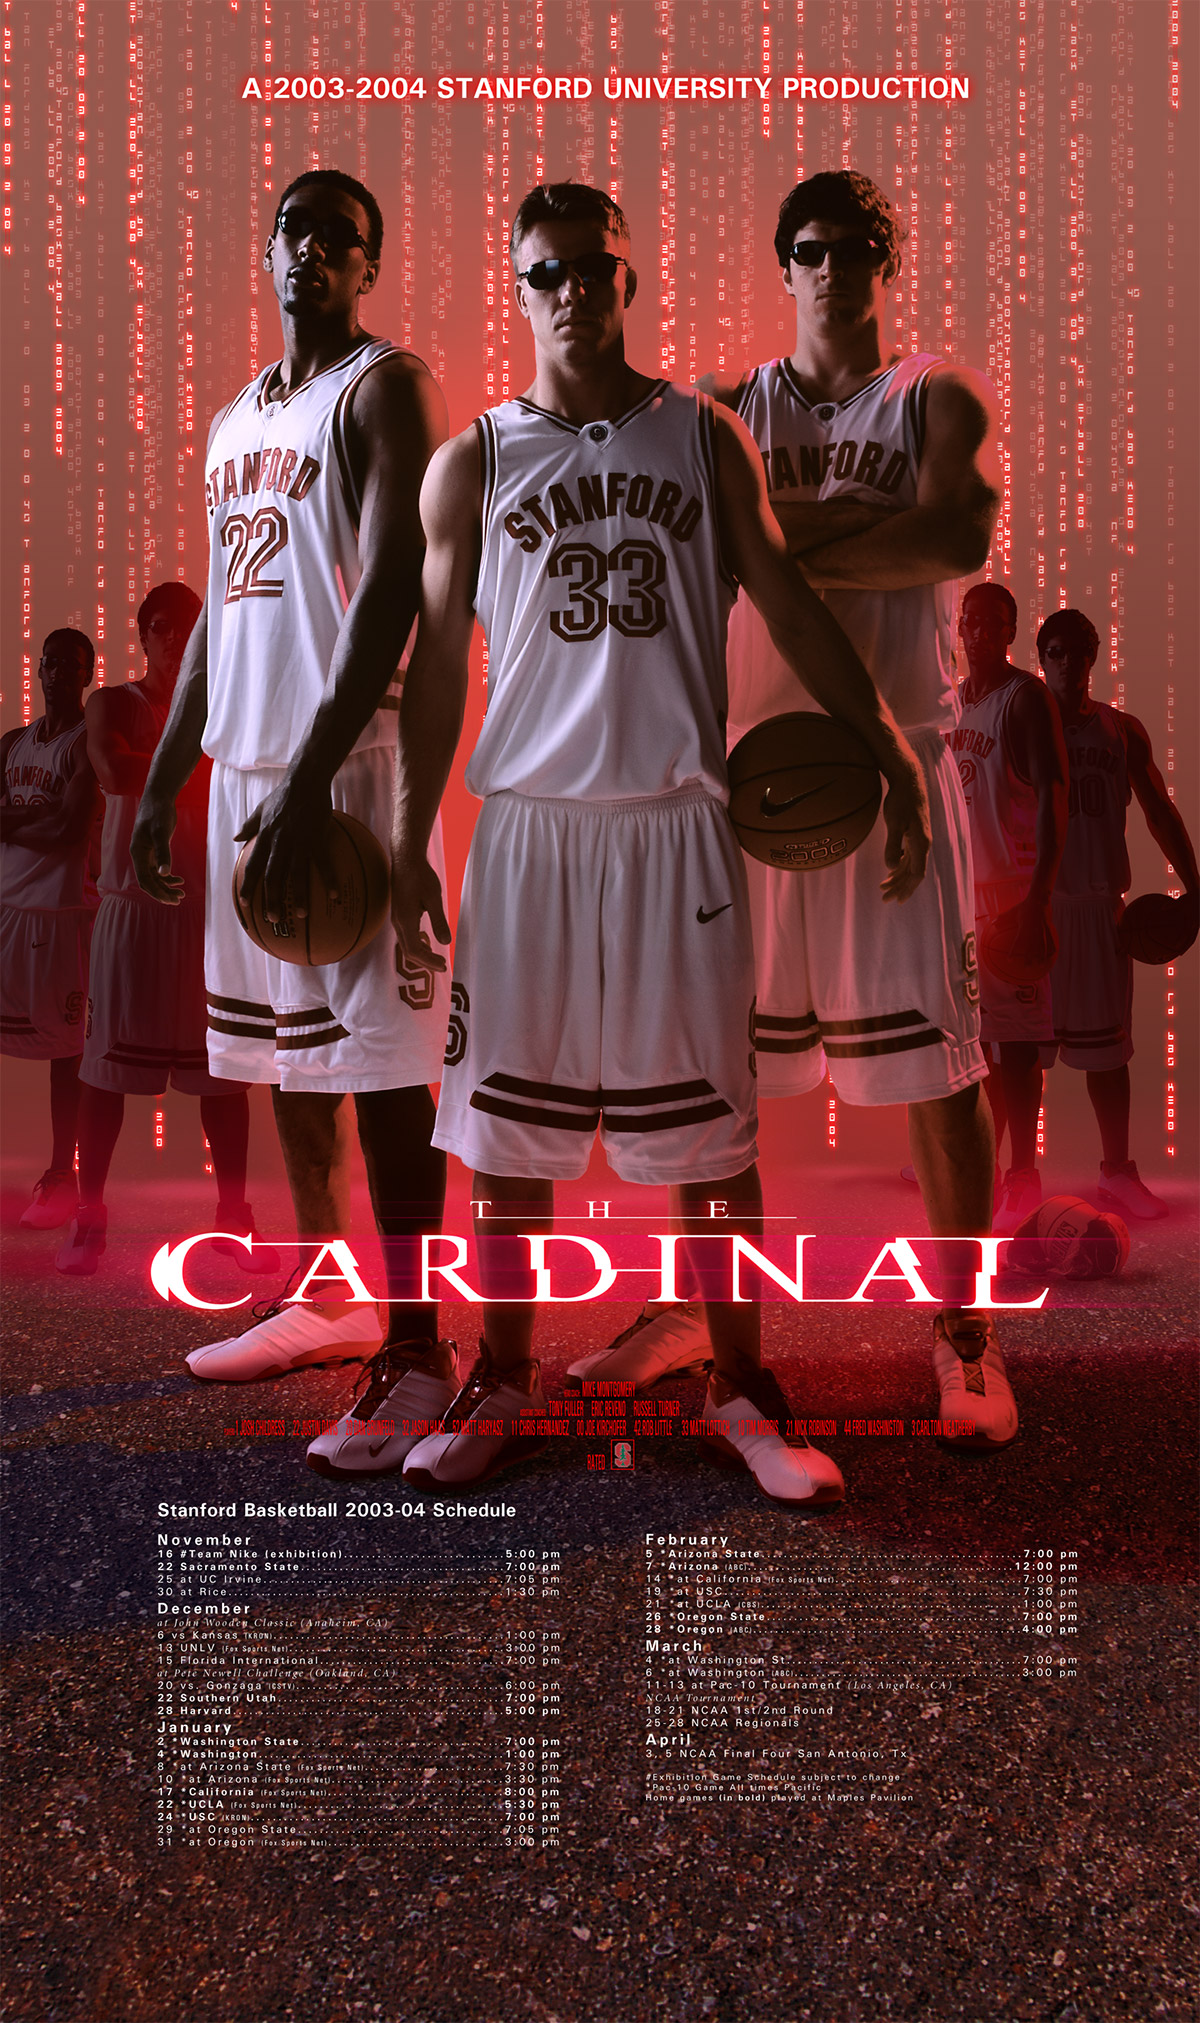
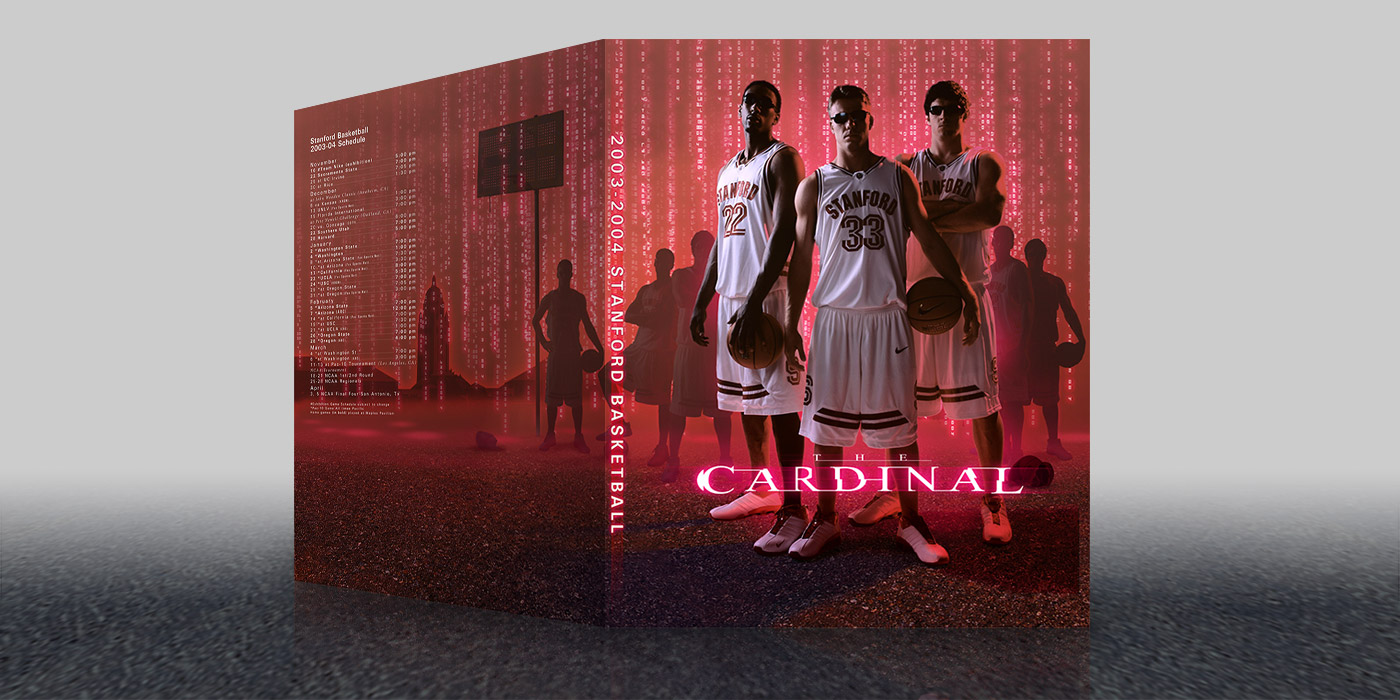
2004 Stanford Basketball Media Guide Cover
Stanford University’s athletics department commissioned Rossman Art to produce sports media guide covers for their football and basketball organizations during 1997-2007, which was when the Matrix films debuted and became part of the popular culture. Rossman Art produced this Basketball Media Guide Cover in collaboration with Terry Smith Creations for Stanford University’s 2004 basketball season. A major purpose for this and other media guides is as a recruiting tool to new players. Media guide covers are often the first introduction for these potential All-Stars. Therefore, an identifiable and eye-catching image is paramount. This design captured that goal in a timely fashion.
View a complete step-by-step process of how this media guide cover was produced in Rossman Art’s Hands On section.
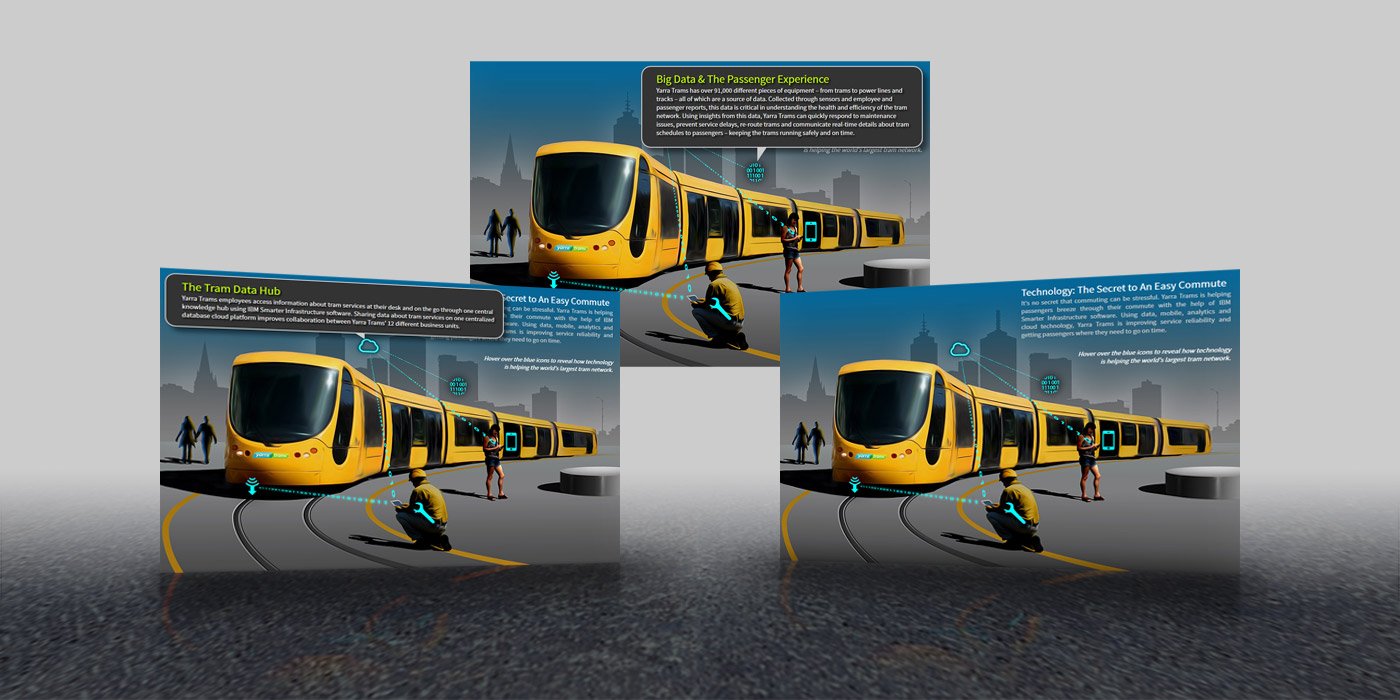
by Rossman Art | Aug 16, 2014 |
Yarra Trams Interactive Infographic Overview
Rossman Art designed and illustrated this interactive Smarter Infrastructure infographic for IBM’s external communications department. IBM used the infographic to help describe real-world use of IBM’s predictive analytics software with Yarra Trams transportation infrastructure. The infographic was assembled in HTML with embedded CSS so the final product could be delivered in as few files as possible. All the graphics reside in a background image while CSS3 handles the rollover effects.
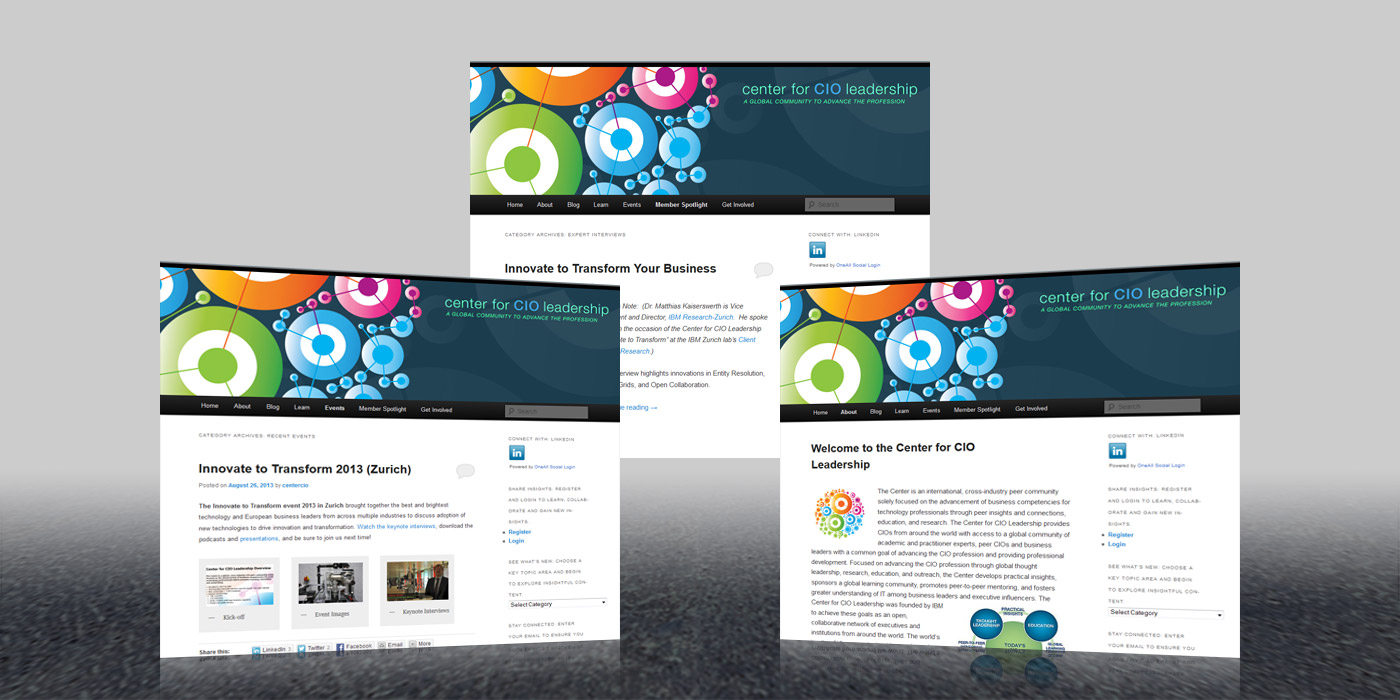
by Rossman Art | Aug 16, 2014 |
Center for CIO Leadership Web Site
Rossman Art designed the graphical skinning for the Center for CIO Leadership site and maintained the content and back-end through WordPress until late 2013. The Center for CIO Leadership migrated this site from a previous JIVE platform to integrate with other social platforms it uses such as LinkedIn. Rossman Art recreated each post and page manually, re-categorizing the content to mirror the structure of the previous JIVE site. The purpose of the new WordPress site was to preserve contributor’s legacy content while providing a better social platform for all subscribers to interact within.
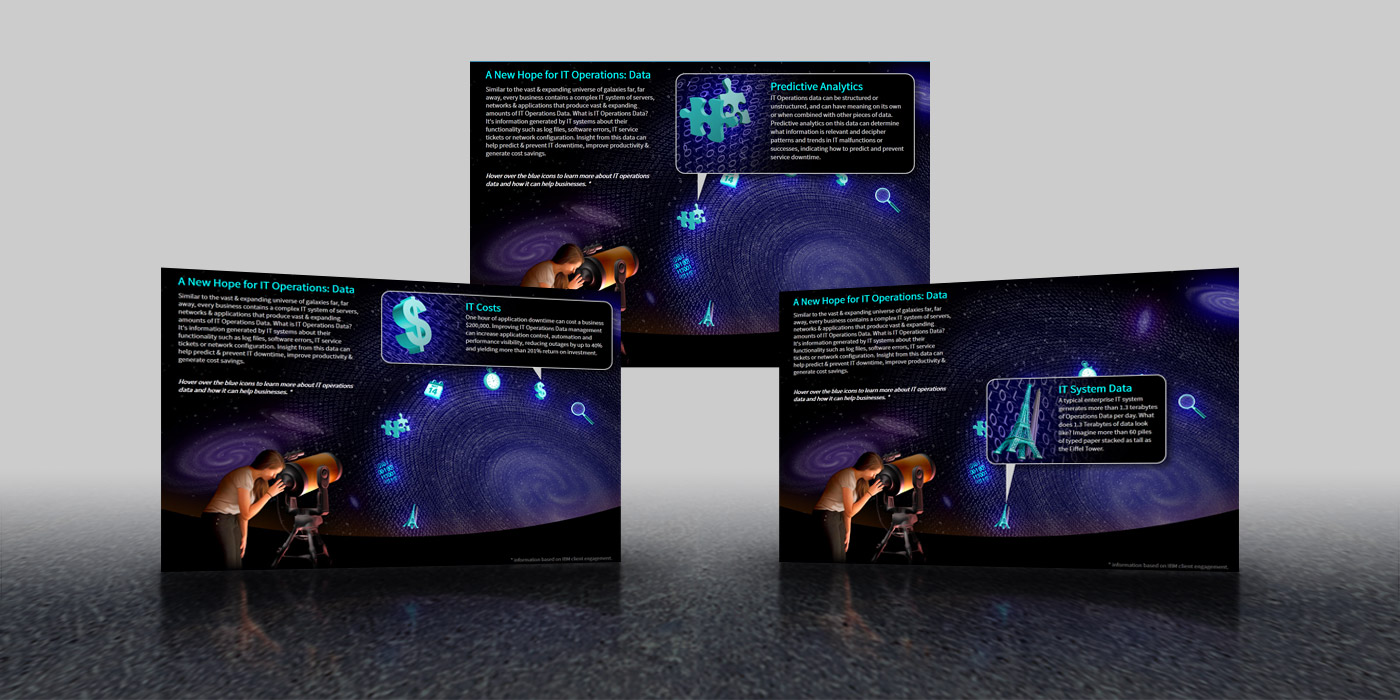
by Rossman Art | Aug 16, 2014 |
IT Operations Data Infographic
Rossman Art designed and illustrated this interactive IT Operations Data infographic for IBM’s internal communications department. IBM used this infographic to help market their software’s predictive analytics capabilities through Real-World illustrated examples and success stories. The infographic was assembled in HTML with embedded CSS so the final product could be delivered in as few files as possible. Only the background and supporting images remain as separate files.