by Rossman Art | Aug 17, 2014 |
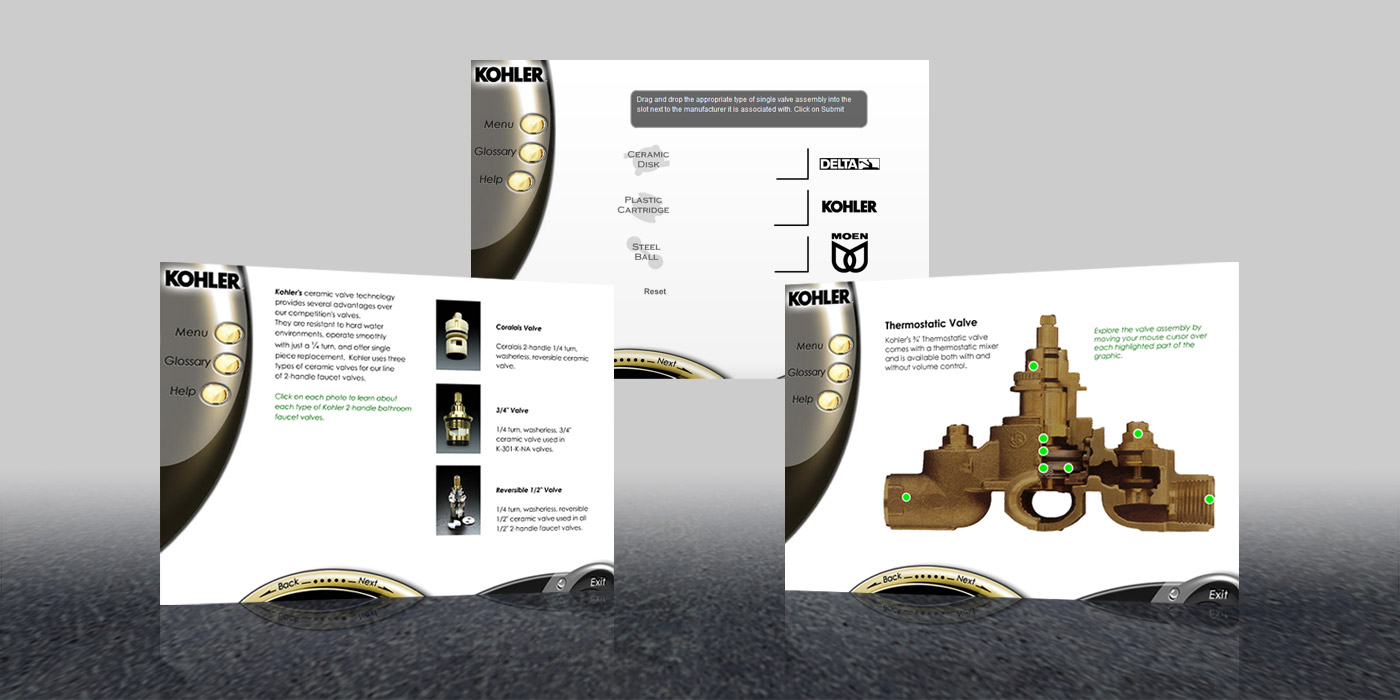
This user interface was developed for Click2learn (now Sumtotal Systems) as an interactive demonstration module for educating Kohler’s prospective clients on the different mechanical elements in Kholer’s valve design. The interactive demo included audio narrative, a short quiz section, and hot spots designed to reveal additional information about Kholer’s valve components.
by Rossman Art | Aug 17, 2014 |
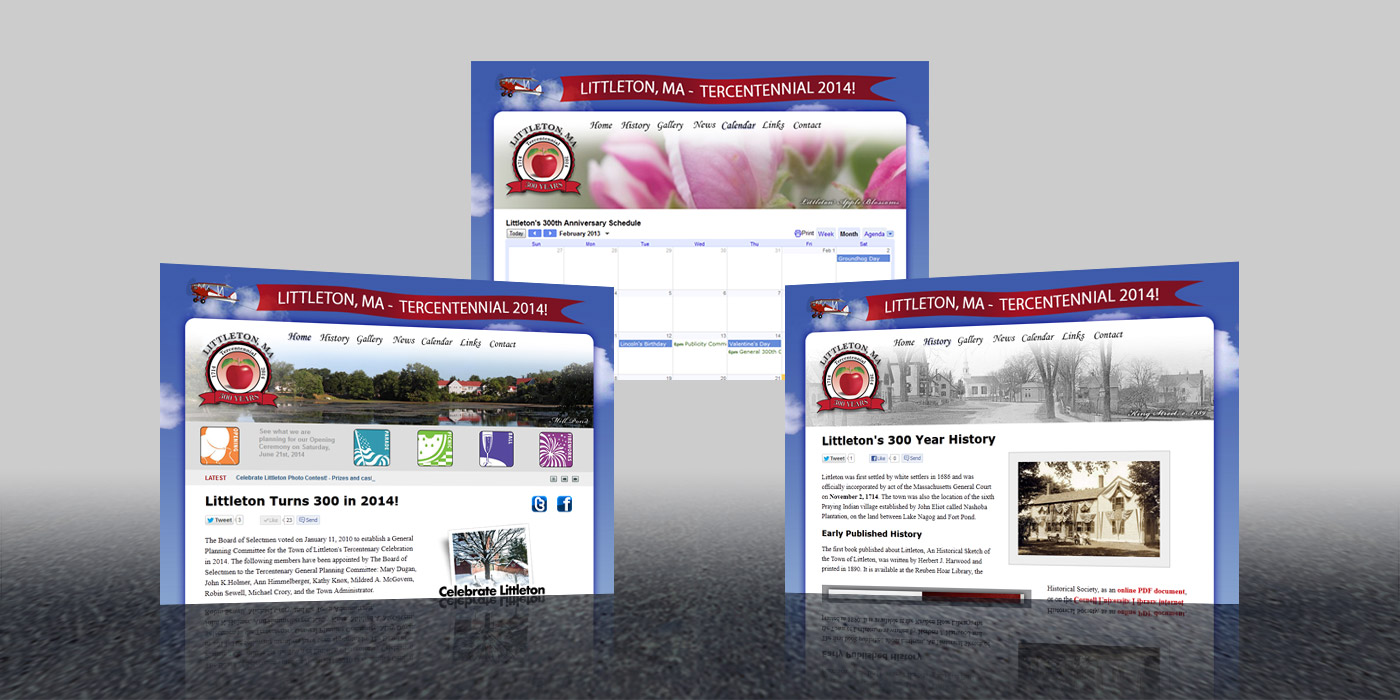
The Littleton 300th web site was a pro bono publico project coded, designed, and maintained by Rossman Art for the Littleton 300th Committee. The site was built one year prior to the 2014 celebration and maintained by Rossman Art into early 2016. The site served as a community information portal leading up to the town’s celebration, a point of reference during the celebration, and as an archive for photos, articles and documents after the tercentennial celebration. The site is still active at littleton300.org, and now maintained by the Littleton 300th legacy committee.
Jeff: In addition to building the Littleton 300th site, I was also involved with the Littleton 300th book project. I used skills I acquired from running a photo restoration business to give the Littleton Historical Society restored high resolution digital copies of historical maps of Littleton. Thee maps were used to lend visual reference to, and supplement writing in the book.
by Rossman Art | Aug 16, 2014 |
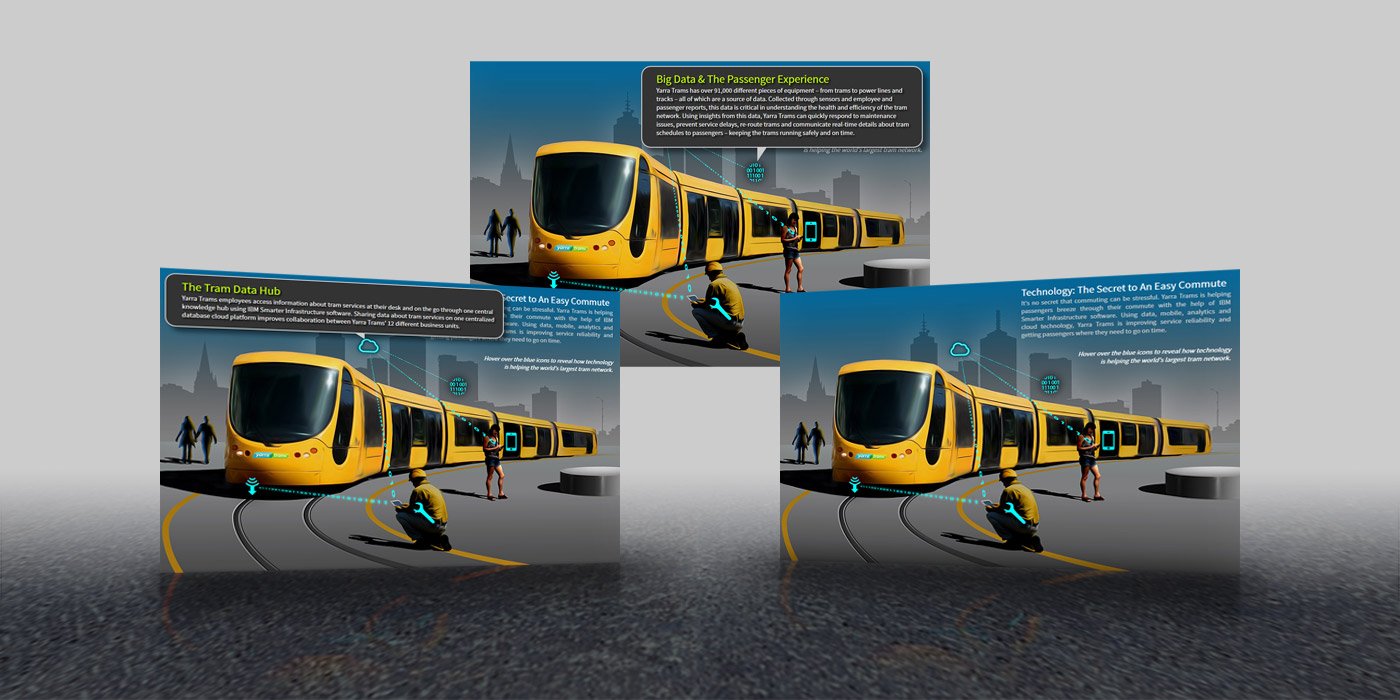
Yarra Trams Interactive Infographic Overview
Rossman Art designed and illustrated this interactive Smarter Infrastructure infographic for IBM’s external communications department. IBM used the infographic to help describe real-world use of IBM’s predictive analytics software with Yarra Trams transportation infrastructure. The infographic was assembled in HTML with embedded CSS so the final product could be delivered in as few files as possible. All the graphics reside in a background image while CSS3 handles the rollover effects.
by Rossman Art | Aug 16, 2014 |
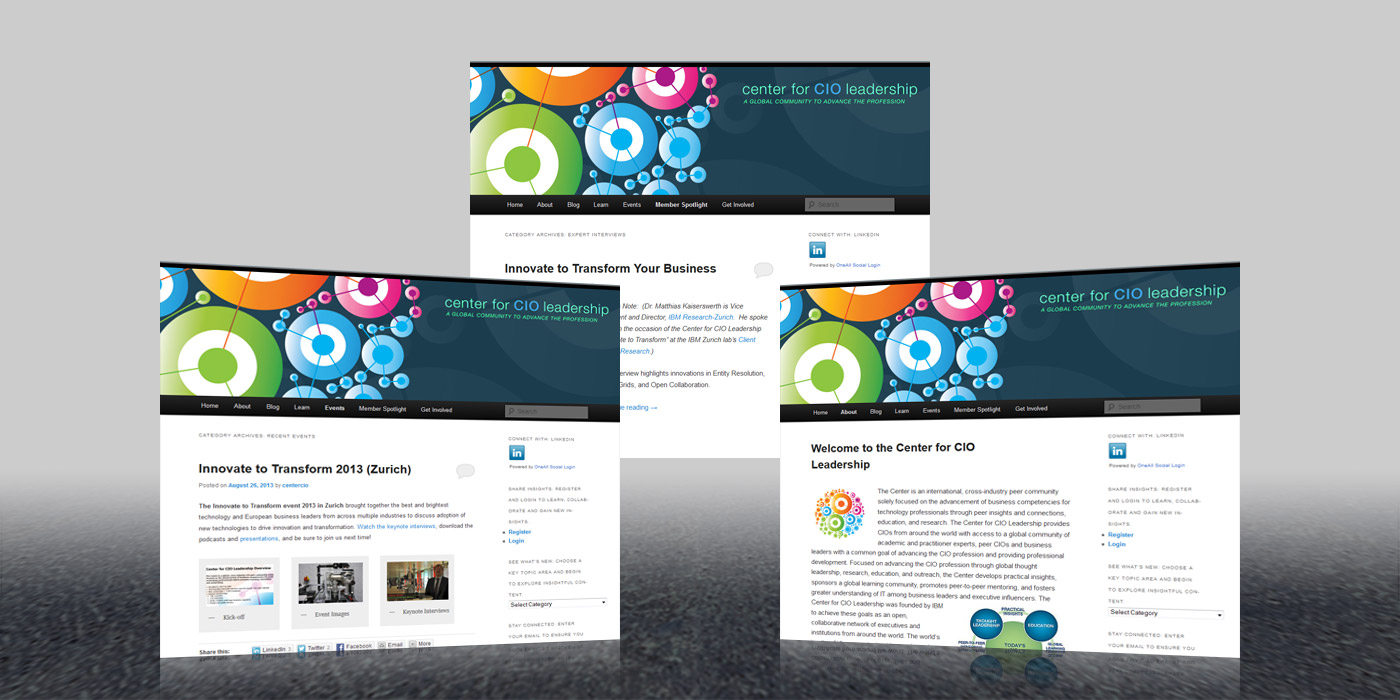
Center for CIO Leadership Web Site
Rossman Art designed the graphical skinning for the Center for CIO Leadership site and maintained the content and back-end through WordPress until late 2013. The Center for CIO Leadership migrated this site from a previous JIVE platform to integrate with other social platforms it uses such as LinkedIn. Rossman Art recreated each post and page manually, re-categorizing the content to mirror the structure of the previous JIVE site. The purpose of the new WordPress site was to preserve contributor’s legacy content while providing a better social platform for all subscribers to interact within.
by Rossman Art | Aug 16, 2014 |
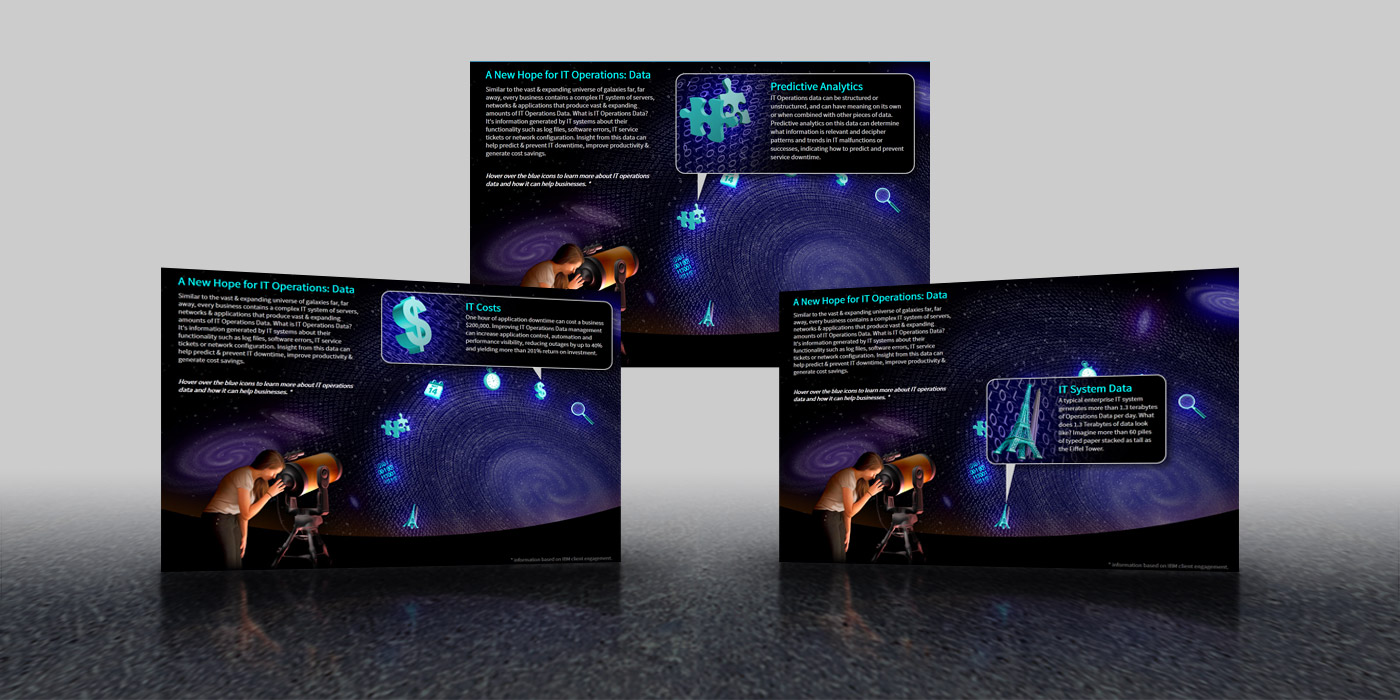
IT Operations Data Infographic
Rossman Art designed and illustrated this interactive IT Operations Data infographic for IBM’s internal communications department. IBM used this infographic to help market their software’s predictive analytics capabilities through Real-World illustrated examples and success stories. The infographic was assembled in HTML with embedded CSS so the final product could be delivered in as few files as possible. Only the background and supporting images remain as separate files.