by Rossman Art | Aug 16, 2014 |
IT Operations Data Infographic
Rossman Art designed and illustrated this interactive IT Operations Data infographic for IBM’s internal communications department. IBM used this infographic to help market their software’s predictive analytics capabilities through Real-World illustrated examples and success stories. The infographic was assembled in HTML with embedded CSS so the final product could be delivered in as few files as possible. Only the background and supporting images remain as separate files.
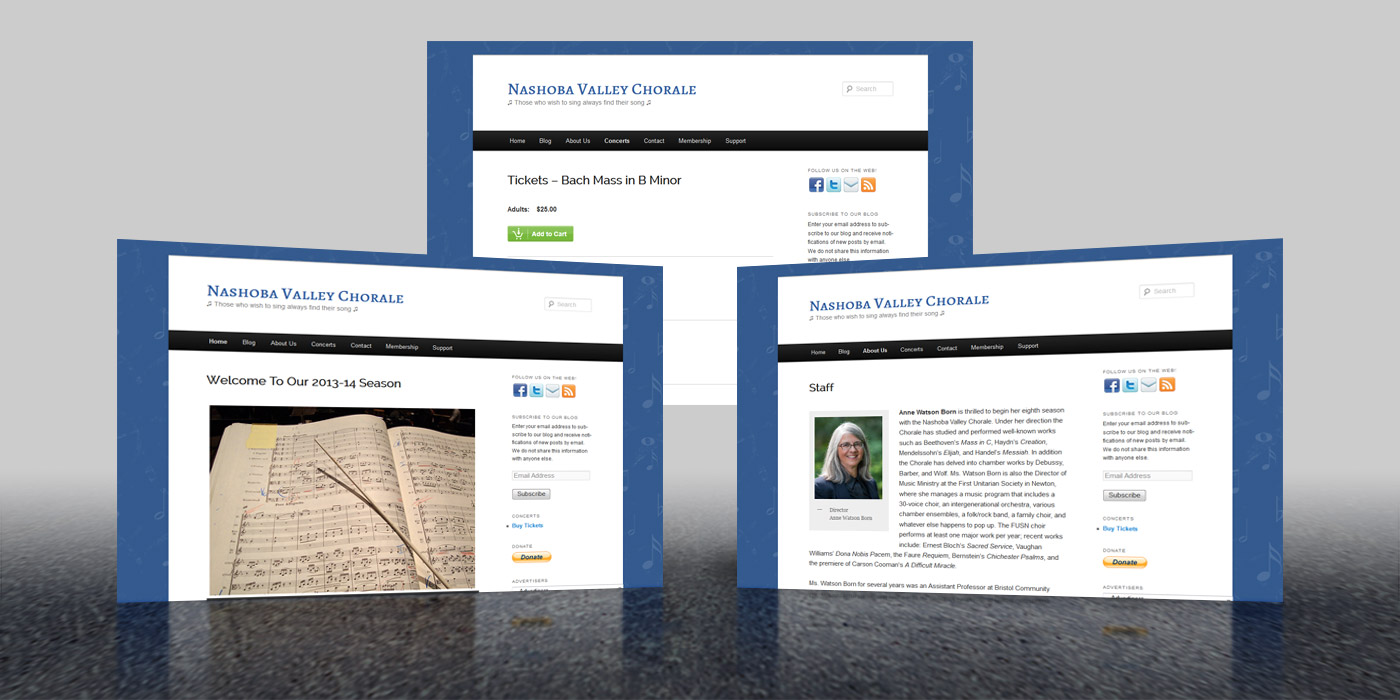
by Rossman Art | Aug 16, 2014 |
Nashoba Valley Chorale commissioned Rossman Art to build them a WordPress site for boosting awareness of their local performances and for selling tickets to their performances. The web site linked to an existing PayPal account for ticket sales. The site was enabled for sales and donations as a non-profit organization through plugins available on the WordPress platform.
Visit the NVC site here; http://www.nashobachorale.org/, and support this group of talented vocal artists.
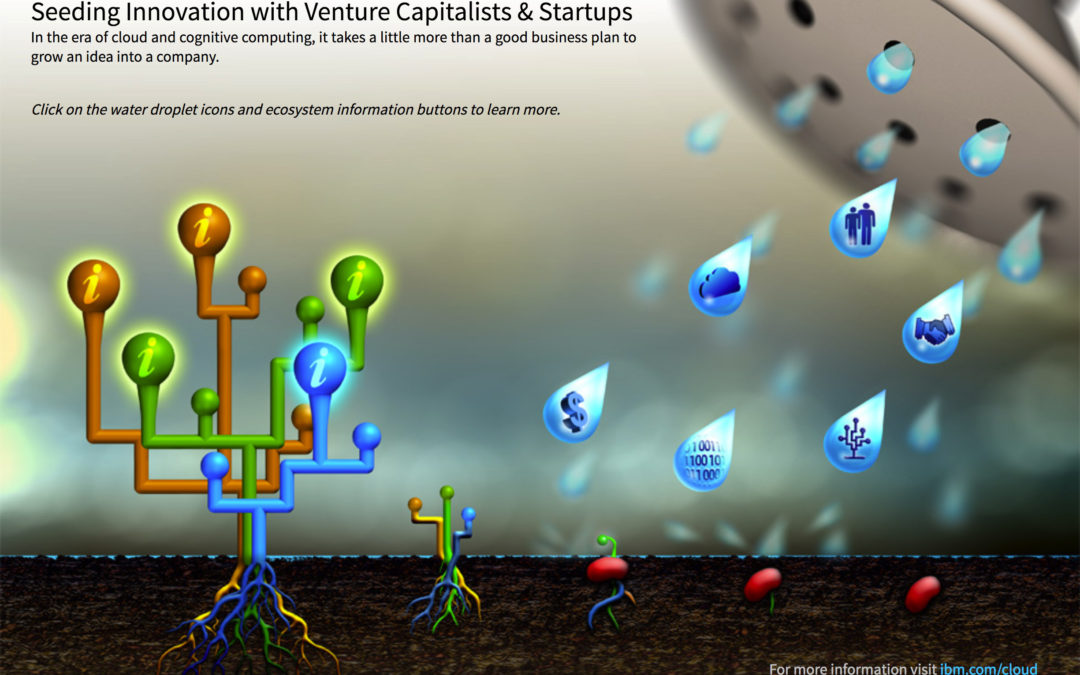
by Rossman Art | Aug 16, 2014 |
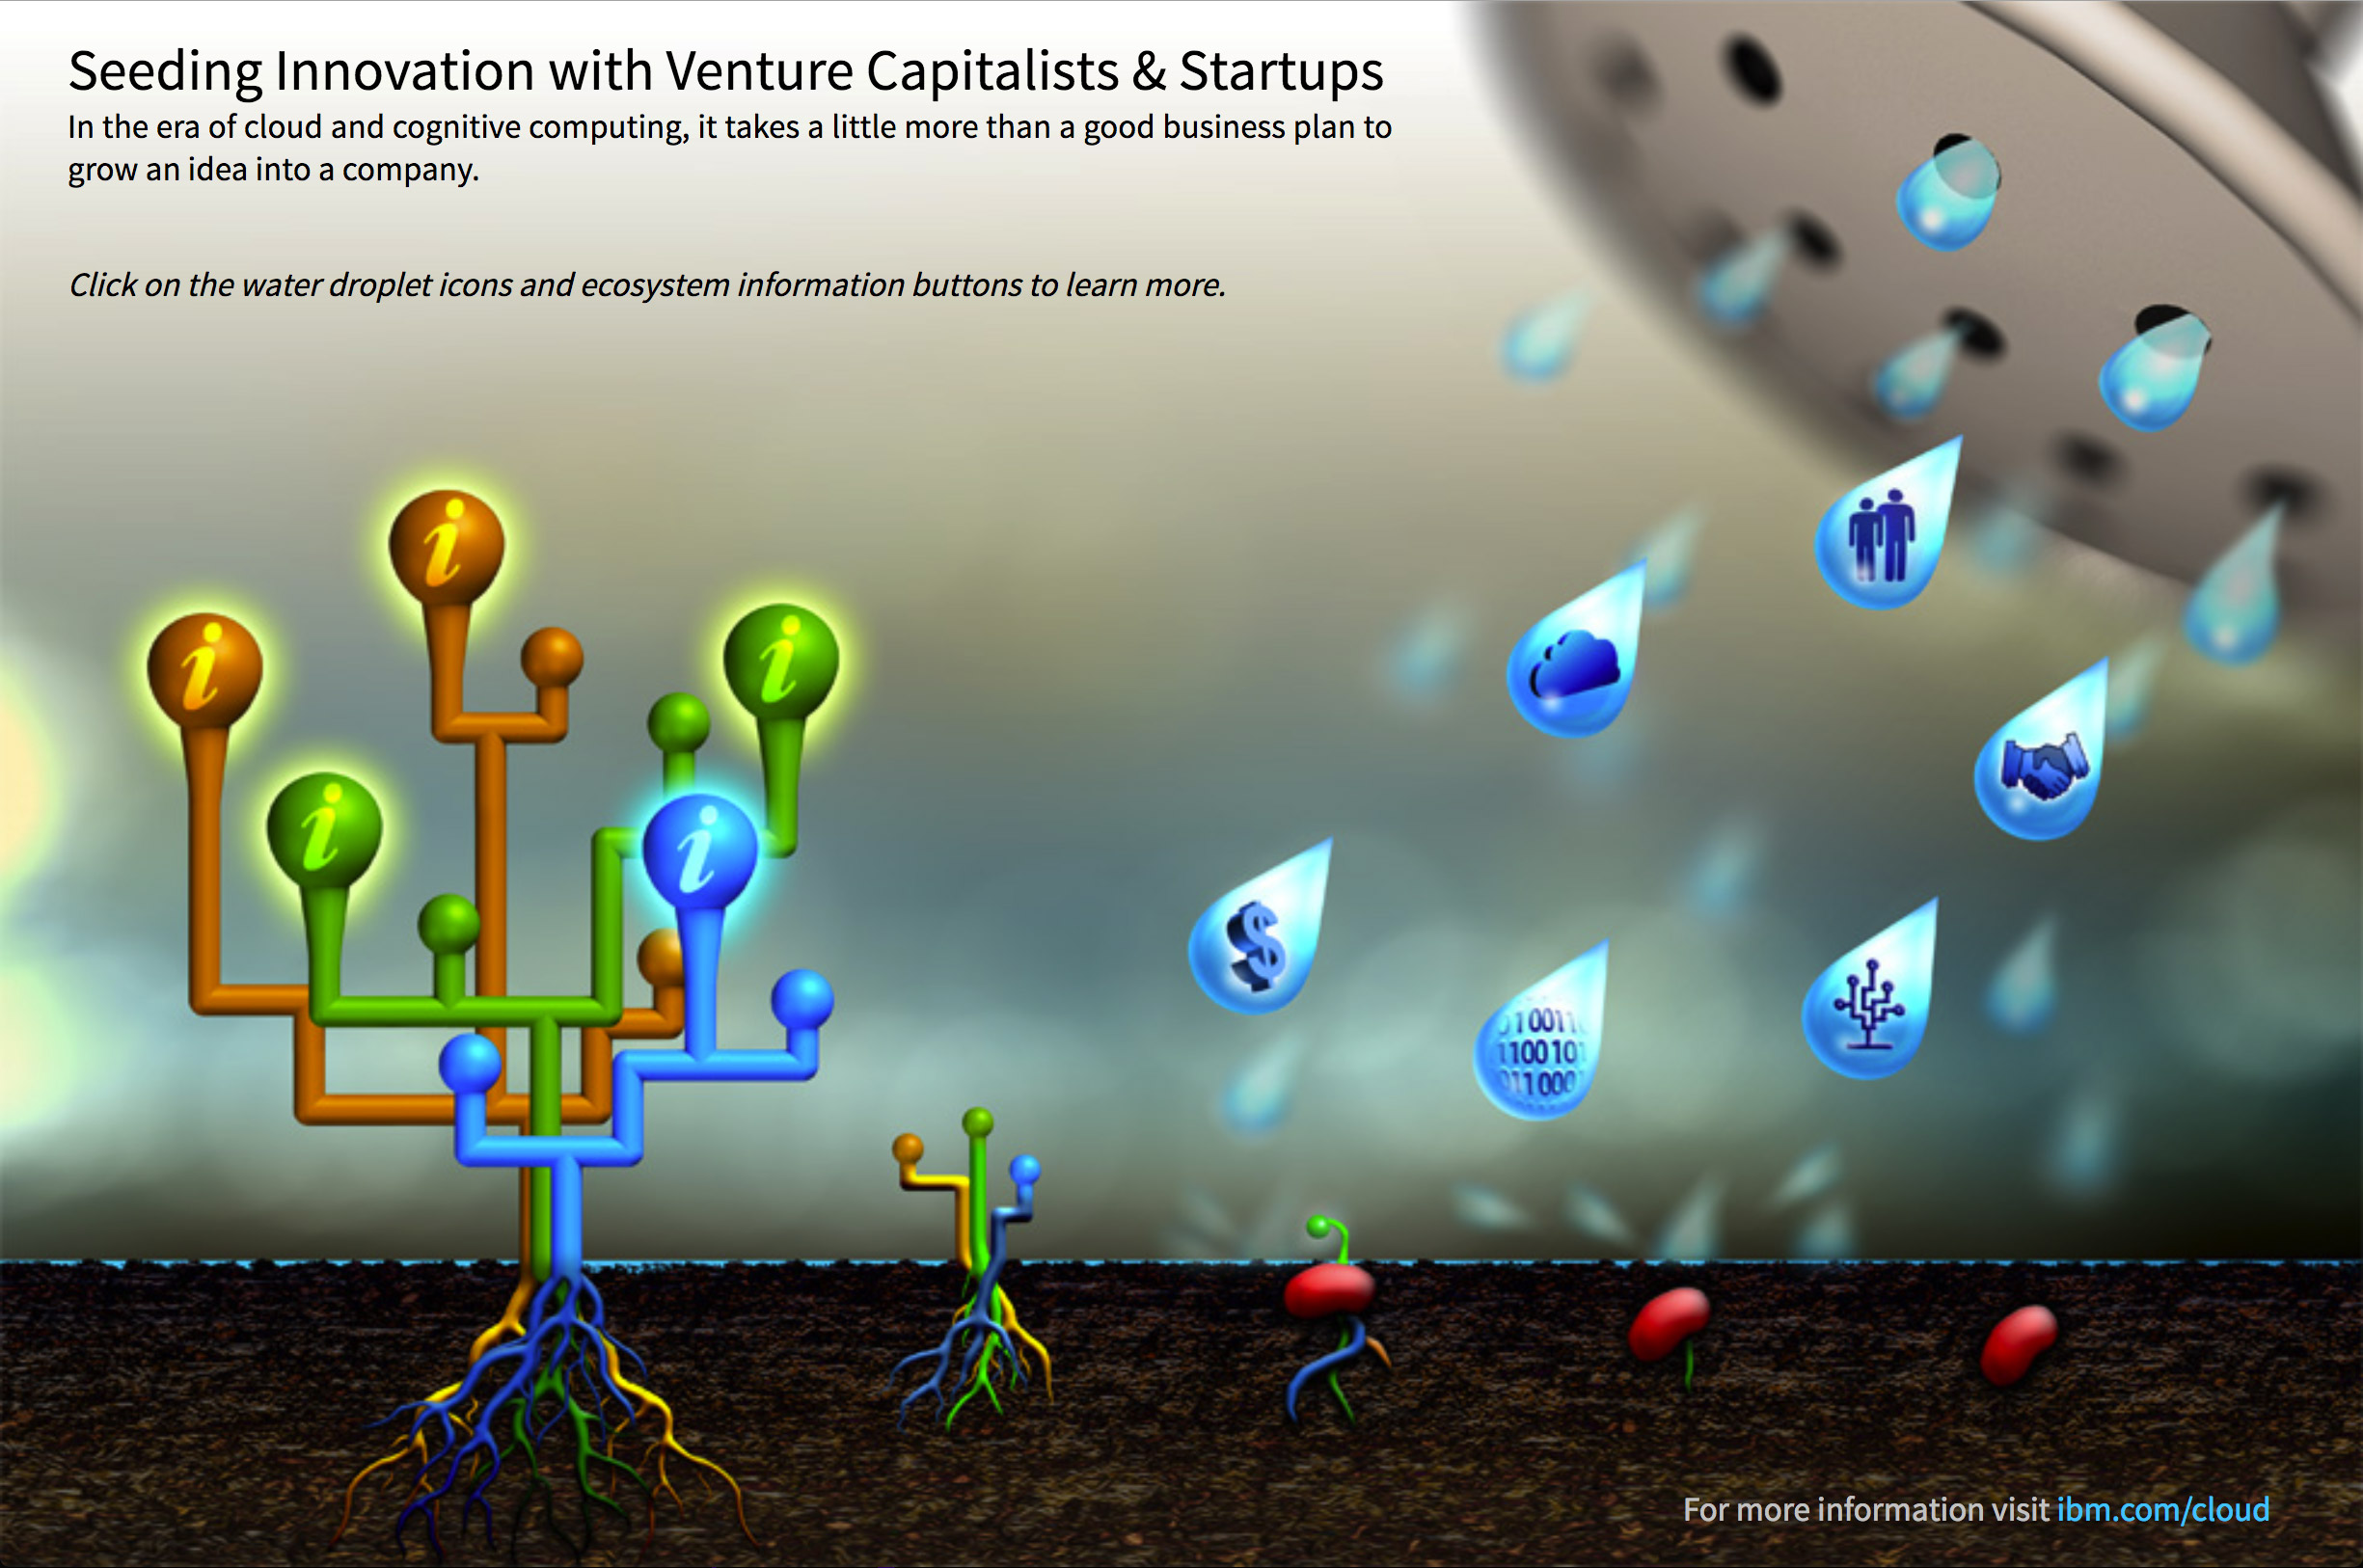
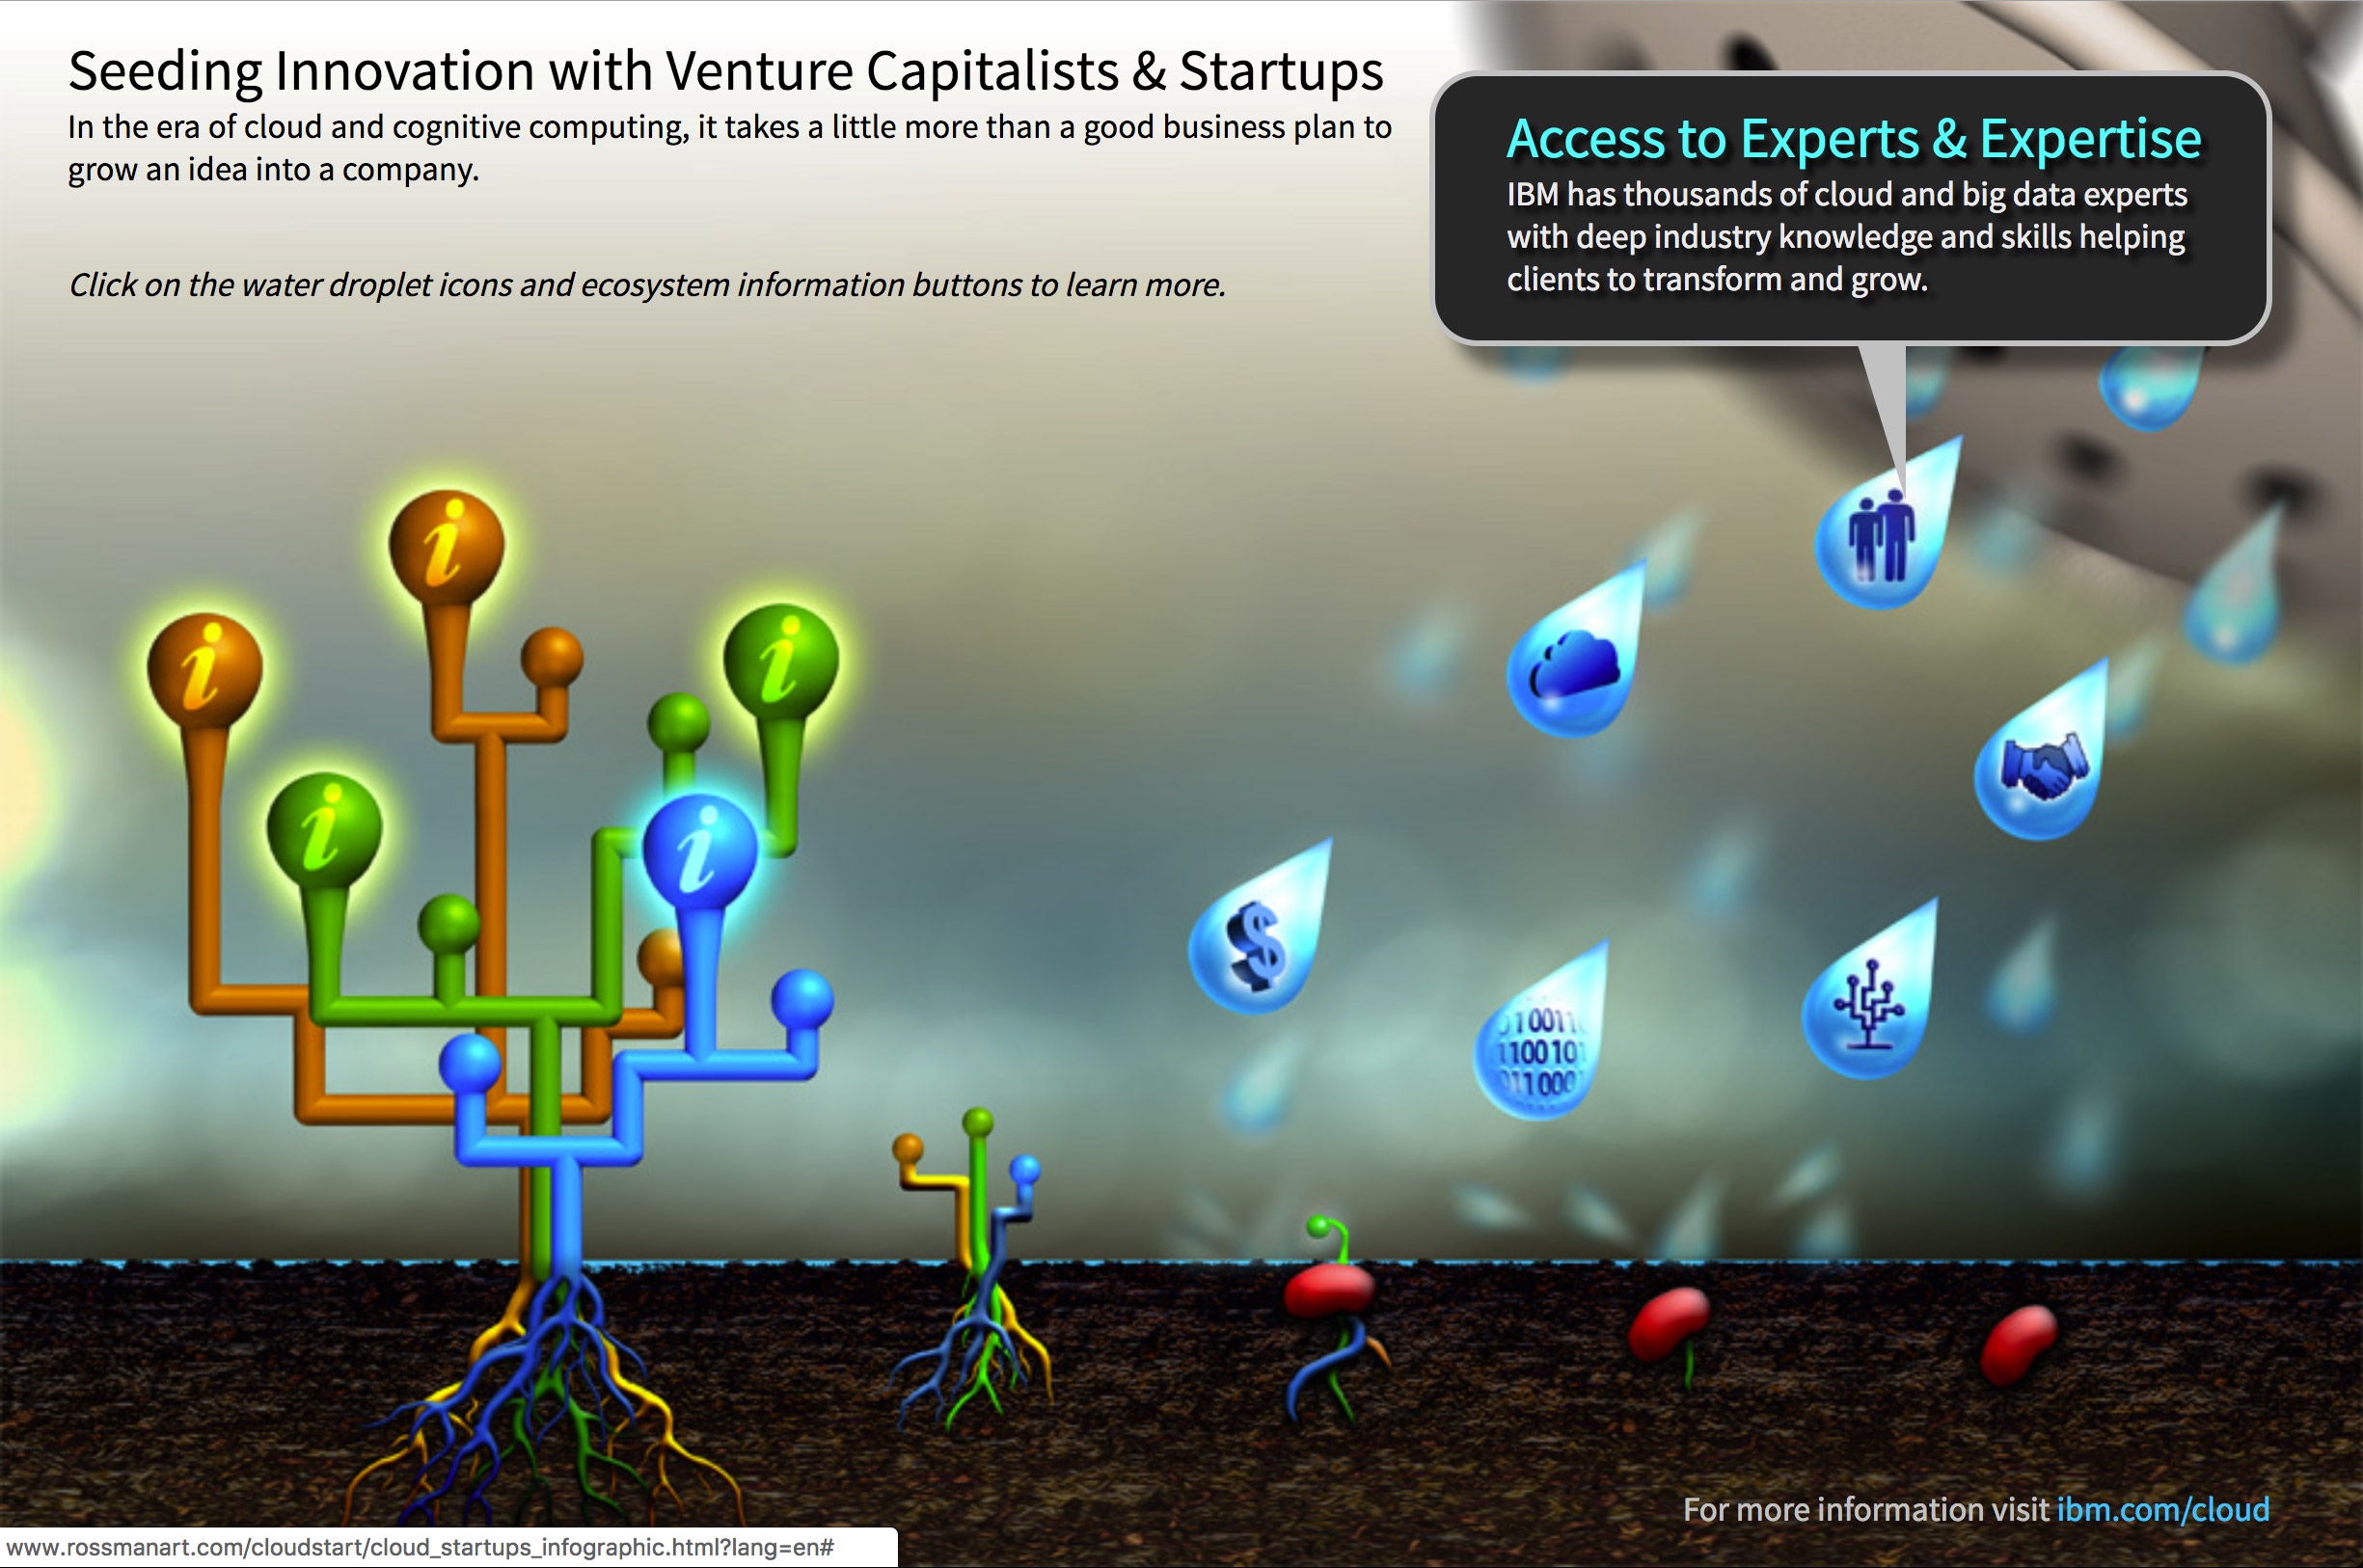
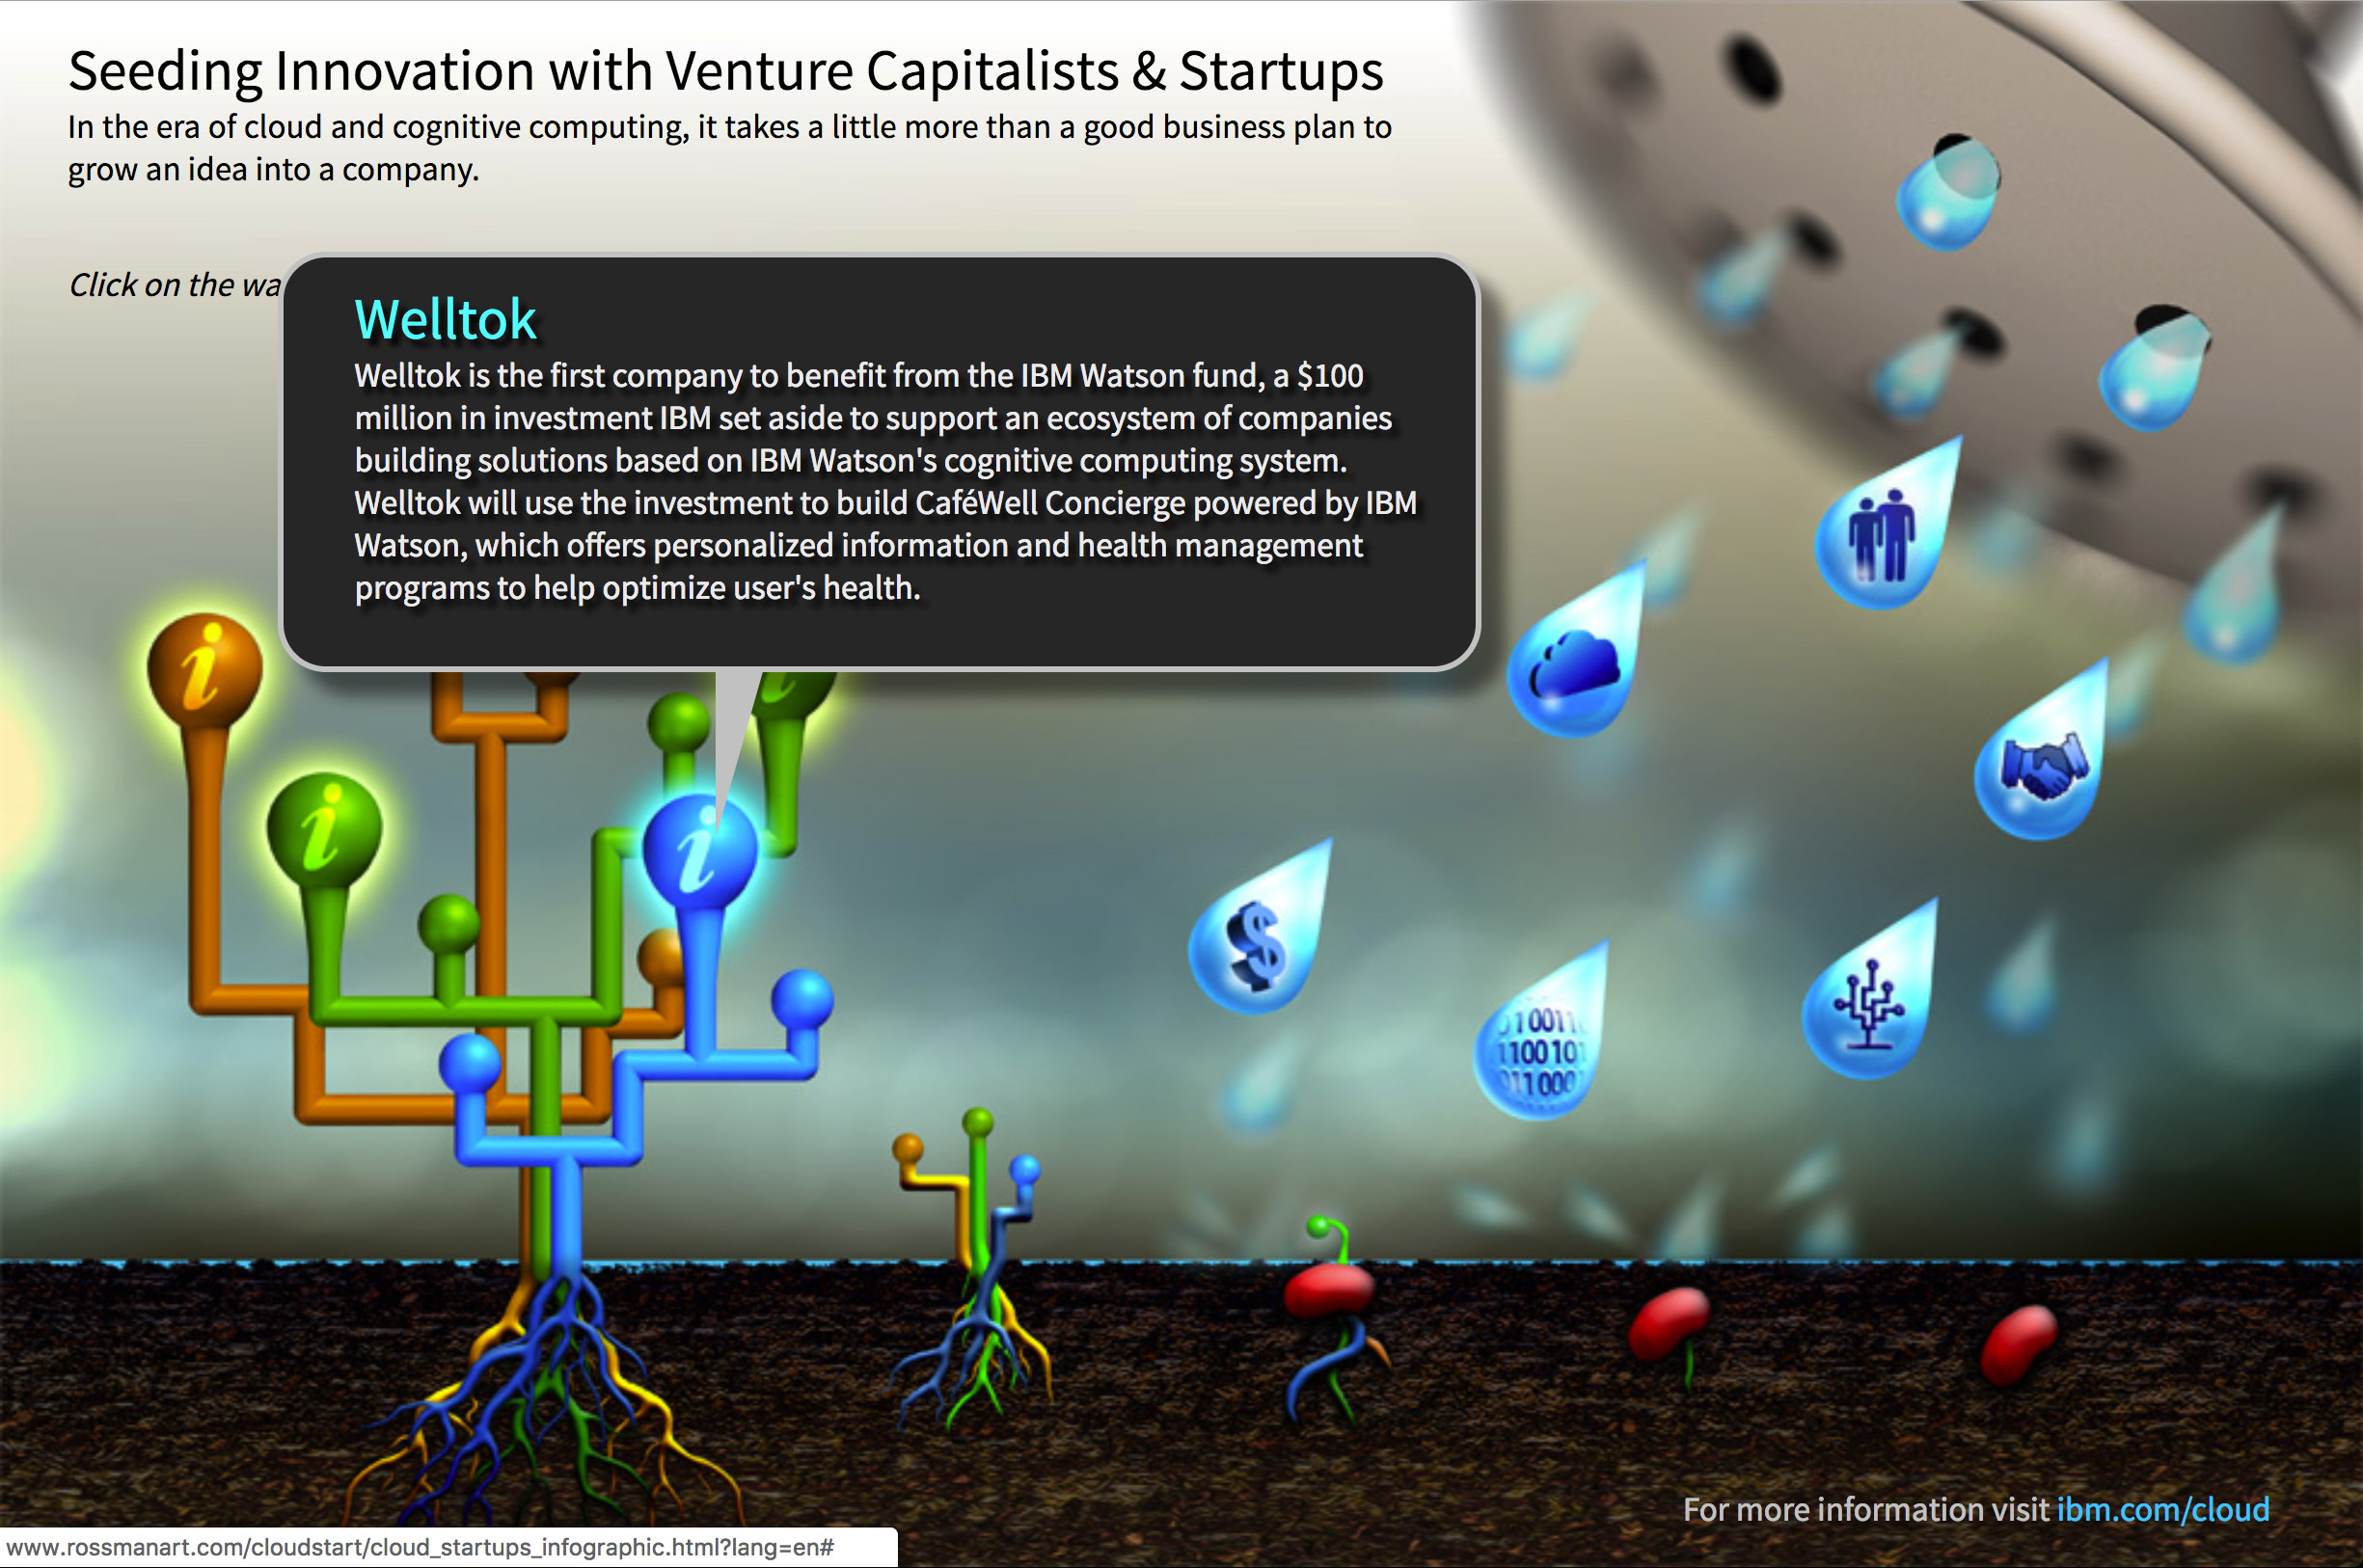
Seeding Innovation Infographic
Rossman Art designed, illustrated, and coded this interactive Seeding Innovation infographic for IBM’s internal communications department. IBM is using this infographic to promote initiatives that help start-ups through specialized software and other services supported by IBM cloud technology.
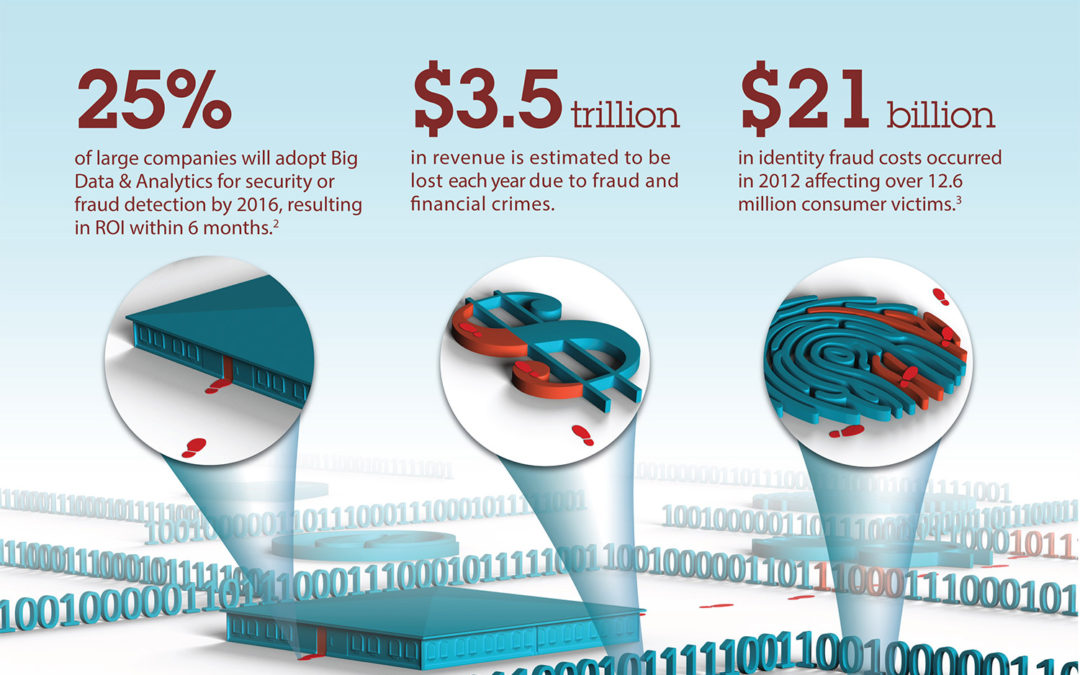
by Rossman Art | Aug 16, 2014 |
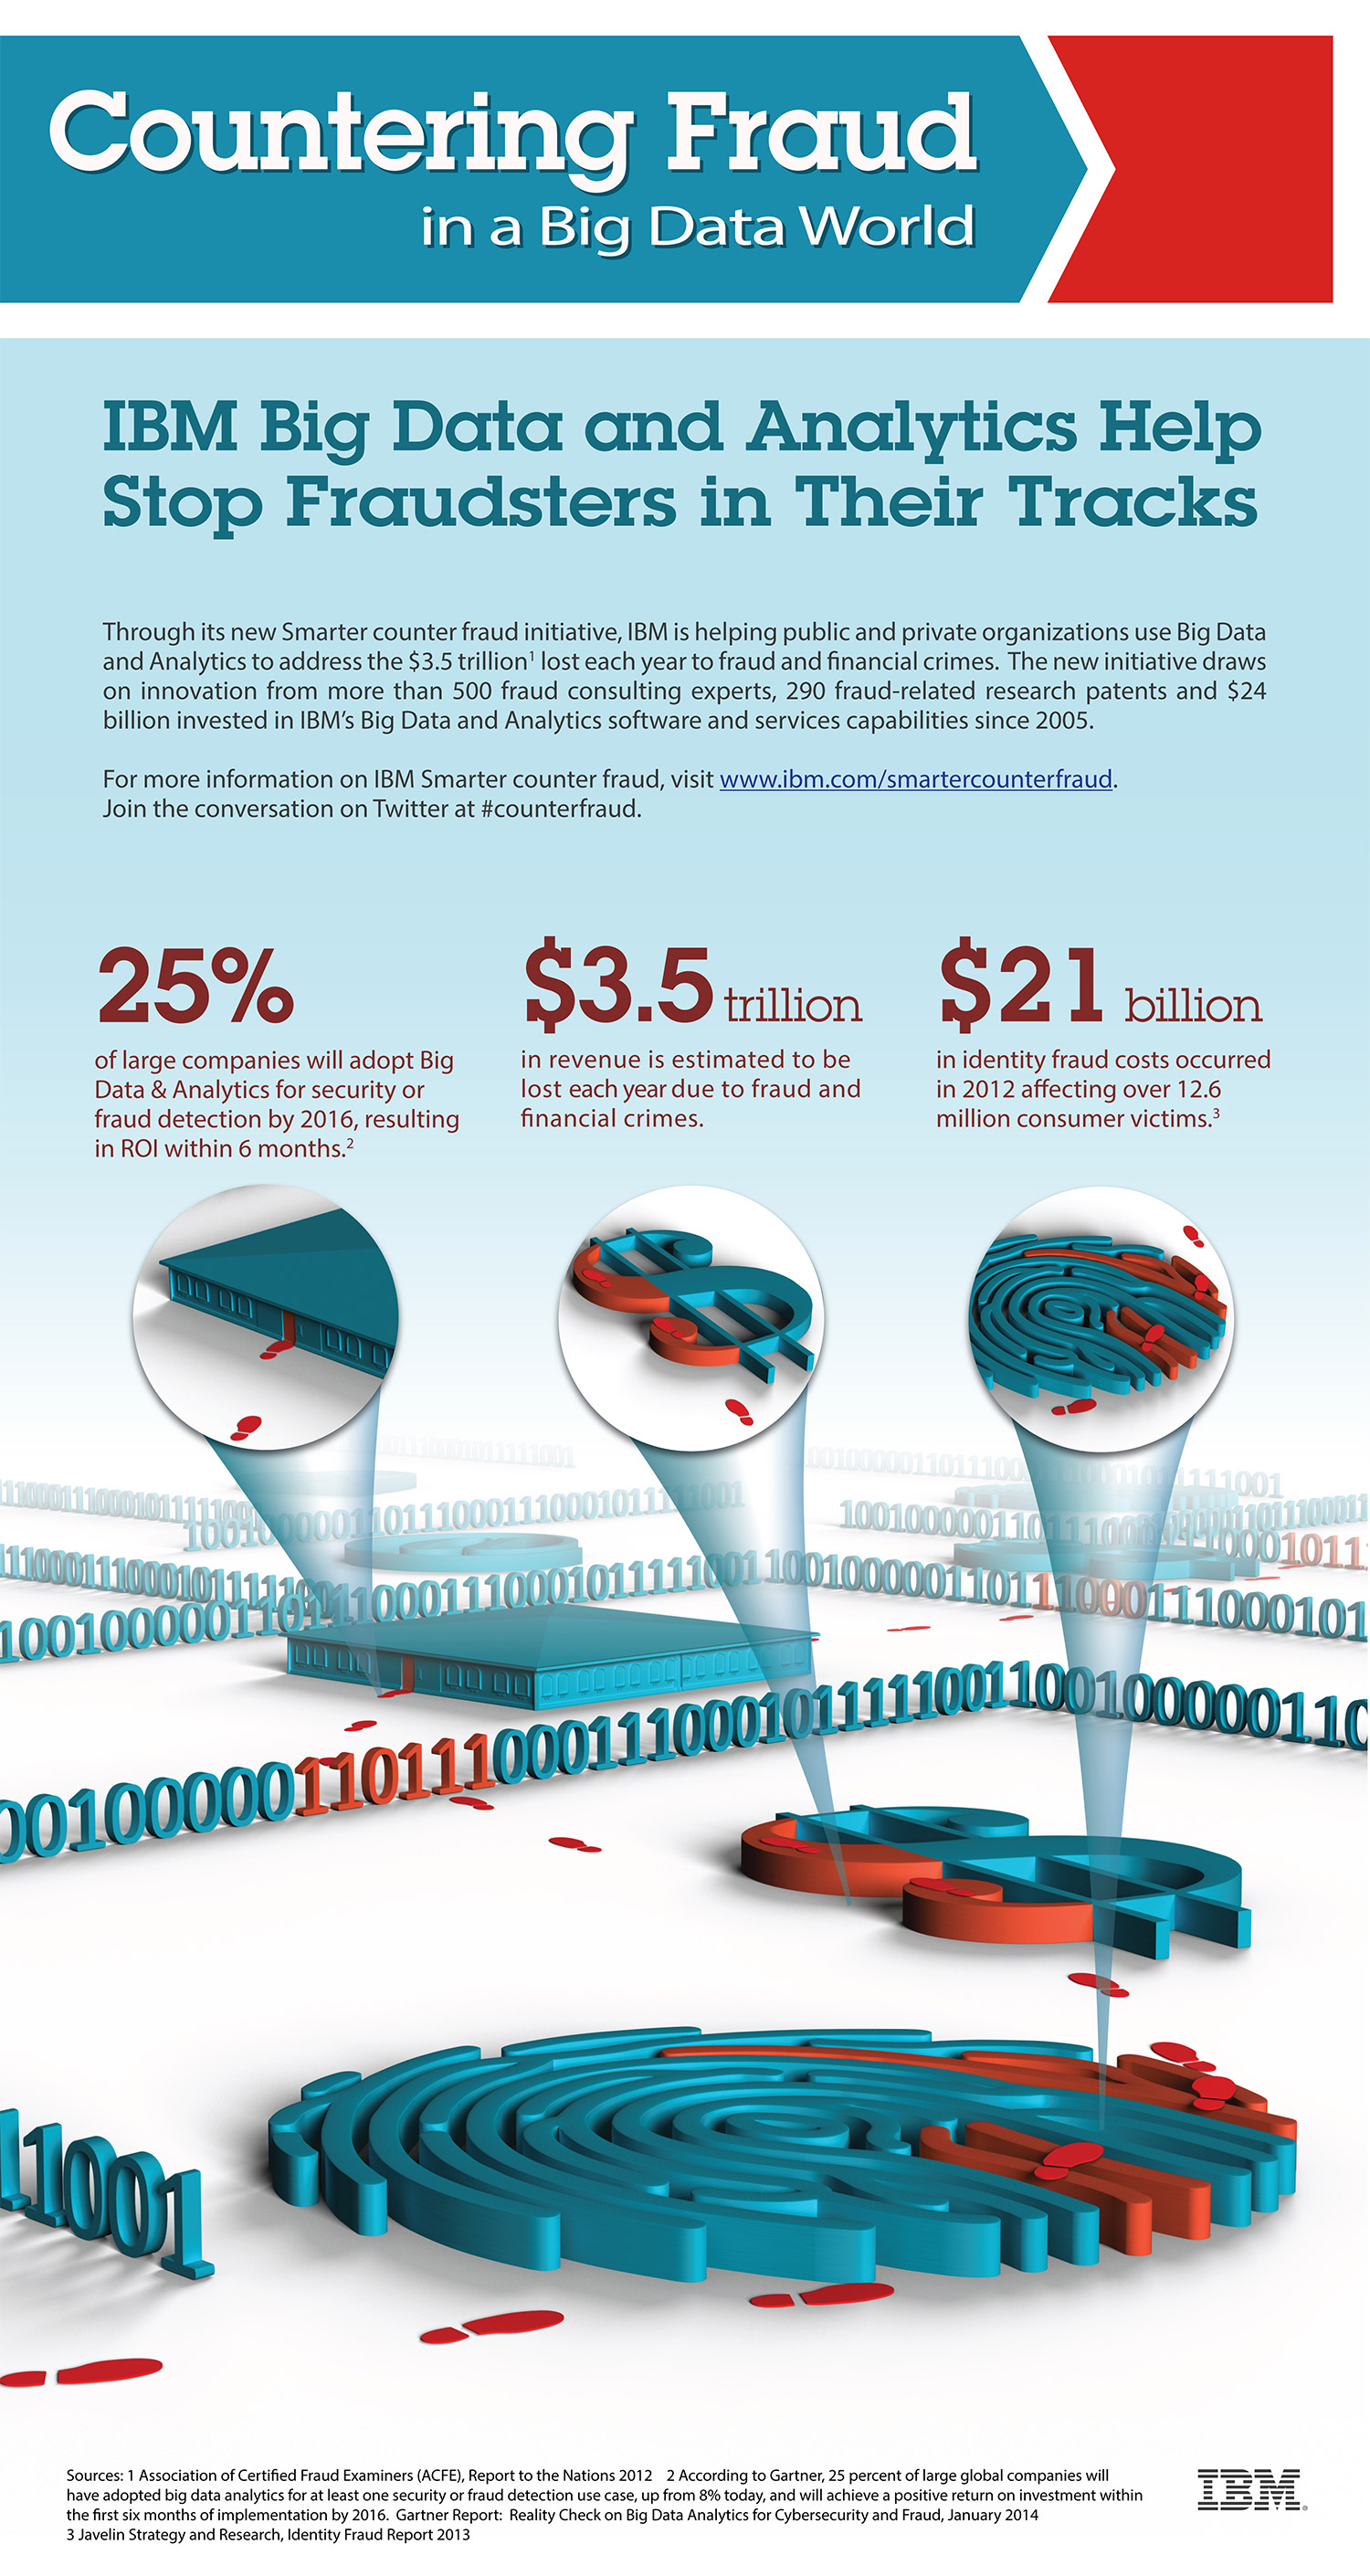
IBM Counter Fraud Infographic
This IBM counter fraud infographic illustrates the concept that fraud is a systemic problem infiltrating vast and critical areas within a Big Data world. Rossman Art designed the infographic to go with news articles in print or web format as a JPEG, but the infographic also acts as a signpost to IBM’s counter fraud initiative when in PDF format with active links. Rossman Art designed the layout in Illustrator and Photoshop as linked smart objects. The copy and design elements are laid out in Illustrator. Three bubble graphics link to a custom view of a 3D render in Photoshop with the lower section of the graphic from a second full perspective view of the same 3D models. The active links must be applied in Acrobat Pro after PDF conversion because this capability is not possible within Illustrator.
Here is an excerpt from an article by the Security Lion Blog featuring this infographic at full resolution:
IBM launches new software and consulting services to help organisations tackle $3.5 trillion lost annually to fraud and financial crime
IBM has introduced new software and services to help organisations use Big Data and Analytics to address the $3.5 trillion lost each year to fraud and financial crimes. Through sophisticated business expertise and analytics, organisations can adopt an holistic approach to address the financial losses caused by fraud while at the same time protecting the value of their brands.
via ‘Smarter Counter Fraud’ initiative | TheSecurityLion.
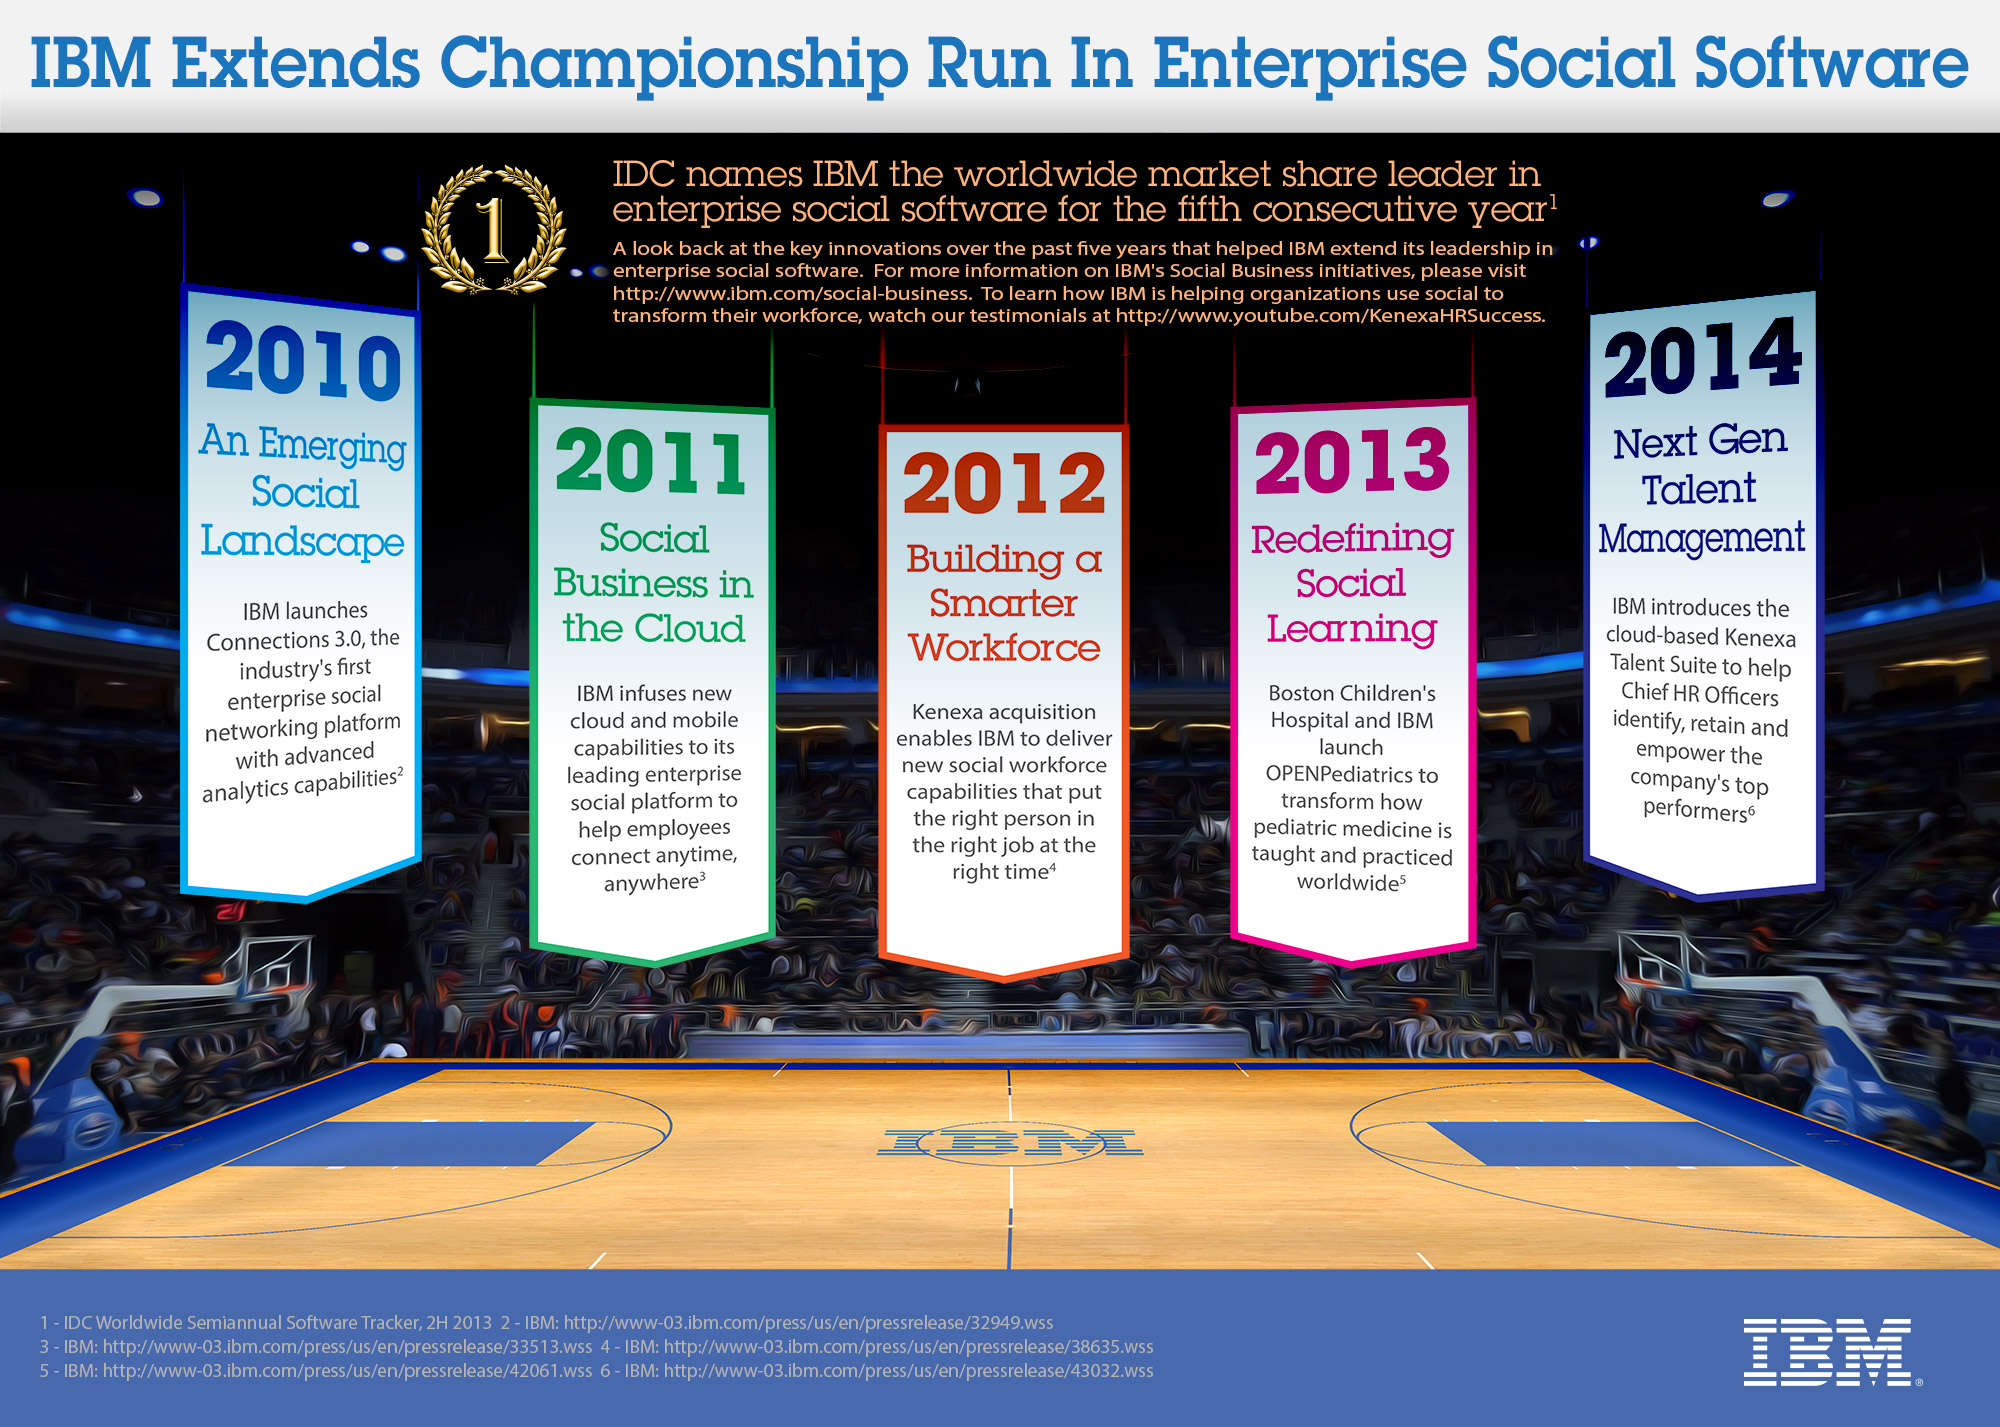
by Rossman Art | Aug 16, 2014 |
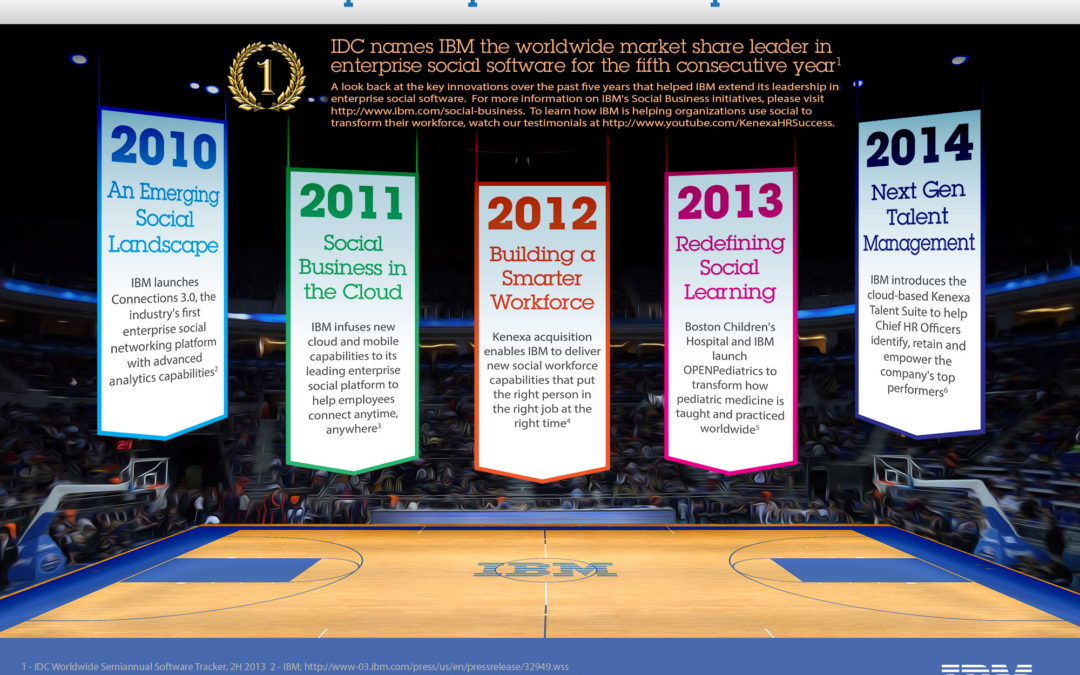
IBM Enterprise Social Software Infographic
This infographic showcases a five-year run by IBM as market share leader in enterprise social software. The graphic’s concept centers around displaying yearly achievements as banners similar to those seen in an NCAA championship arena.
Here is an excerpt from the associated news release:
IBM News room – 2014-04-24 IBM Named Worldwide Market Share Leader in Enterprise Social Software for Fifth Consecutive Year – United States
Armonk, NY – 24 Apr 2014: IBM (NYSE:IBM) today announced that for the fifth consecutive year, IDC ranked the company number one in worldwide market share for enterprise social software. According to IDC’s analysis of 2013 revenue, the worldwide market for enterprise social software applications grew from $968 million in 2012 to $1,242 million 2013.
via IBM News room – 2014-04-24 IBM Named Worldwide Market Share Leader in Enterprise Social Software for Fifth Consecutive Year – United States.


